How teachers of Years 4–8 students analyse, interpret and use information from the Progressive Achievement Test: Mathematics
Amanda Caldwell and Eleanor Hawe
http://dx.doi.org/10.18296/am.0019
Abstract
Assessment can be powerful when teachers are able to analyse, interpret and use information in ways that enhance their teaching and programmes, and students’ learning. A qualitative approach was used to investigate how teachers of Years 4–8 students analyse, interpret and use information gained from administration of the Progressive Achievement Test: Mathematics (PAT: Mathematics) assessment tool. Six teachers from two schools in a rural district, south of Auckland, participated in the study. Teachers at one of the schools had access to the NZCER online marking and analysis service; teachers at the other school did not. Data were gathered through a series of semi-structured interviews and the collection of relevant documents. Both schools had a long-standing commitment to PAT: Mathematics. However, once teachers passed students’ stanine scores to management they were free to further analyse and use the information, or not, as they saw fit. It was concluded that a systematic and planned approach to the analysis, interpretation, and use of data is needed if students, teachers, schools and other stakeholders are to get full value from the PAT: Mathematics tool.
Assessment for teaching and learning
Assessment for teaching and learning refers to the planned and deliberate collection of information by teachers with a view to using this information to plan and implement programmes of work and adjust teaching so students’ curriculum-related learning needs are addressed. It highlights the mediating role of teachers and teaching in the learning process, through the gathering and use of assessment information to inform planning and teaching, which in turn supports and furthers student learning. As portrayed in Cowie and Bell’s (1999) model of planned formative assessment, assessment for teaching and learning is underpinned by three processes: eliciting; interpreting; and taking action. Eliciting involves the teacher intentionally gathering information about students’ progress in learning—in particular, their curriculum-related knowledge, understanding, and skills, both before and during a unit of work. This information may be gathered from the class through a standardised test or task, the collection of work samples, and the use of pre- or post-lesson quizzes. The teacher then takes time to analyse and interpret the assessment data in relation to criteria and/or norms to determine what it means in terms of students’ learning. A range of knowledge bases (Shulman, 1987) is drawn on to help the teacher identify what is important in the data and make informed evidence-based judgments about cohort, group, and individual areas of strength and need. Taking action involves the teacher using the information to make planning, programme, and teaching decisions with the intent of enhancing students’ learning. While a key purpose of assessment for teaching and learning is for the teacher “to obtain feedback to inform her or his teaching” (Cowie & Bell, 1999, p. 103) information can also be shared with students as together teachers and students address the questions “where am I going”, “how am I going”, and “where to next” (Hattie & Timperley, 2007).
Teachers’ use of assessment information to inquire into teaching practice and inform decisions is fundamental to effective practice (Parr & Timperley, 2008). The study reported in this article investigated how primary school teachers understand and use information gained from one assessment tool, the Progressive Achievement Test: Mathematics (PAT: M), to inform their programme development and teaching, and support students’ learning.
The Progressive Achievement Test: Mathematics
Schools and teachers employ a range of tools to assess students’ mathematics knowledge, understanding, and skills. In terms of externally produced tests and tasks, those used by New Zealand primary schools include IKAN, GloSS, e-asTTle, and PAT: M. Each tool is designed with a particular focus in mind, and as such has specific strengths and contributions to make to programme development, teaching and learning (Joyce, 2006).
PAT: M is a standardised measure comprising fifteen tests that assess Years 4–10 students’ mathematical knowledge, skills, and understandings with reference to the New Zealand curriculum (Darr, Neill & Stephanou, 2007). Distinctive features of the revised PAT: M include: the assessment of students’ knowledge, understandings, and skills in five content categories aligned to the mathematics curriculum; the provision of norm-referenced information in the form of stanine scores so results can be compared with the achievement of a national reference group at specific year levels; and the use of scale scores (patm) that present student achievement on a developmental continuum with reference to each of the five content categories, allowing students’ progress to be tracked over time (Darr et al., 2007). Moreover, different kinds of analyses and reports can be generated to provide descriptive and comparative information about students’ mathematical knowledge, understanding, and skills at the individual, group, class, and cohort levels. When appropriately interpreted, results from PAT: M “assist teachers to make informed decisions about the kind of teaching materials, methods, and programmes most suitable for their students” (Darr et al., 2007, p. 7). It is thus well suited to providing schools and teachers with information they can use (in association with other data) to evaluate, plan and develop programmes and ways of teaching that promote students’ learning in mathematics (Joyce, 2006).
Traditionally, students use individual test booklets and fill in separate answer sheets as they answer the multi-choice items. Acetate marking sheets are provided so tests can be hand marked. Alternatively schools can enter students’ responses into NZCER’s automated online marking service or send answer sheets to NZCER for scanning and marking. Schools also have the option, since 2006, of getting students to complete PAT: M online. Once marked, a student’s raw score is converted into a scale score (patm) and stanine score. Schools that do not make use of NZCER’s Marking Service can access templates in the Teacher Manual (Darr et al., 2007) to produce individual student reports which provide an overview of student achievement including patm and stanine scores, percentile rankings, and information about the accuracy of student’s responses to questions in each of five content areas: number knowledge; number strategies; geometry and measurement; statistics; and algebra. The latter reports provide valuable information that can be used to identify broad areas of class and/or group strength and weakness in mathematics learning. A wider range of more specific reports is available to those who use NZCER’s Marking Service, including more detailed item reports, a class report, a year group progress report, and a school report.
Teachers’ use of formal standardised assessment tools to inform teaching and learning
Although the research literature in New Zealand is fairly small and somewhat dated in relation to teachers’ use of formal standardised assessment tools, it has been observed that primary school teachers consider anecdotal and observational evidence to be of more value than information from formal assessment tools when planning and developing class, group, and individual programmes of work (e.g., Dunn & Marston, 2003b; Hawe, Dixon, Williams & Tuck, 2003; Symes & Timperley, 2003; Timperley, 2005). Teachers have tended to ignore information from standardised tools when thinking about programme and teaching decision-making (Parr & Timperley, 2008) as they deem such information to “[have] little educational benefit for students” (Harris & Brown, 2009, p. 371). When teachers have used formal standardised tests, they have often struggled to accurately analyse and interpret information (Dixon & Williams, 2003; Parr & Timperley, 2008), in particular information from progressive achievement tests (Torrie, 2012). As a corollary, they have not been in a position to develop appropriate evidence-based programmes that address cohort, group, and individual learning needs highlighted in such tests (Parr & Timperley, 2008; Torrie, 2012).
Teachers’ use of PAT: M to inform teaching and learning
In 2003, Dunn and Marston (2003a; 2003b) published results from a survey of 339 teachers and school managers about the classroom assessment tasks in English and mathematics used by teachers of Years 5 and 7 classes. In mathematics, the most widely used externally produced tool by teachers of Years 5 and 7 students was PAT:M, while the most widely used of the teacher- or school-developed strategies was observation. However, when reflecting on the usefulness of all listed tools “for providing information for teaching and learning” (Dunn & Marston, 2003b, p. 44) PAT:M was ranked twelfth out of thirteen by Year 5 teachers and thirteenth out of fourteen by Year 7 teachers, with observation ranked first by teachers at both levels of schooling. Clearly, while PAT:M was widely used, teachers did not consider it particularly useful for planning and developing teaching and learning programmes. In contrast, school managers ranked PAT:M the third most useful tool out of six mathematics assessments for Year 5 classes, and first out of seven tools for Year 7 classes. Since this time, PAT:M has been revised and is now supported by online administration, marking, and reporting. As a result, today’s classroom teachers may have a different view of its usefulness.
While Dunn and Marston (2003a; 2003b) investigated what assessment tools teachers used, and beliefs about their usefulness, no information was available about whether and how teachers analysed, interpreted, and acted on the information they gathered. Given the dated nature of many of the aforementioned studies, it is timely to revisit the area. The current small-scale study reported in this article examined how six primary teachers of Years 4–8 students at two schools understood and used information from PAT: M. More specifically, it addressed the following questions:
•Why do teachers use PAT:M?
•How do teachers who do not utilize NZCER’s Marking Service analyse, interpret and use information from PAT:M?
•How do teachers who utilize NZCER’s Marking Service interpret and use information from PAT:M?
•What differences are there in the analysis, interpretation, and use of information between those who do and do not use NZCER’s Marking Service?
The research design
An interpretive framework and qualitative methodology framed the study so insights could be gained into how teachers make sense of and understand their world (Braun & Clarke, 2013). A combination of purposive and convenience sampling was used to select two schools as sites for the study. With reference to the former, both schools needed to: have three or more teachers of Years 4–8 students at the school; use PAT:M; and the teachers of Years 4–8 students were to be unknown to the first author (researcher). Further, one of the two schools needed to use NZCER’s Marking Service. In terms of convenience, it was necessary for the two school sites to be in rural South Auckland to facilitate access by the researcher. There was no intention for the schools and teachers to be representative of the wider population of New Zealand primary schools and teachers; they were to simply represent themselves. However, because little of human behaviour is unique, the reasons why one or a small group of people think, believe, or act as they do may suggest an explanation for why others belonging to the same group think, believe, or act as they do (Berg, 2009). Readers can decide whether the circumstances and findings of the study are similar enough to their own situation or experiences to enable them to safely ‘transfer’ the findings (Lincoln & Guba, 1985).
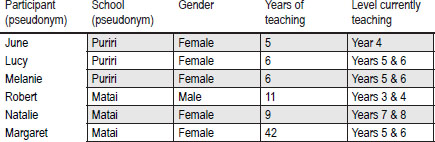
The selected schools were Puriri (pseudonym), a decile 5 contributing primary school (Years 1–6) where teachers used PAT:M but did not use NZCER’s Marking Service, and Matai (pseudonym), a decile 7 full primary school (Years 1–8) where teachers used PAT:M and NZCER’s Marking Service. Three teachers from each school at the designated year levels agreed to participate in the study. Table 1 summarises information about the six teacher-participants.
Table 1. Participants, school, gender, years of teaching and current teaching level
Each teacher agreed to take part in two tape-recorded semi-structured interviews carried out in August and September. The first interview (30–40 minutes) established understandings about and experiences with PAT:M, in particular why each teacher used the tool. The second interview (30–45 minutes) followed up areas of interest after an initial analysis of the first interview, then dealt more specifically with how the teacher analysed, interpreted, and used the data. Interview schedules with indicative questions were prepared with the schedule for the first interview trialled on a teacher from a school not involved in the study. This trial helped the first author reflect on and “hone” her interview techniques and questioning skills, in particular use of probes and wait time. The teachers were asked to bring documents to the second interview such as anonymised student or class or cohort reports, or a combination of all, as well as documents illustrating analysis and planning which resulted from use of PAT:M. These documents were to serve as aide-memoires during the interview, with a view to prompting more detailed and specific explanations, and were collected after the interview for further analysis. All interviews, with permission, were audiotaped and transcribed then offered to respondents for verification or amendment.
The constant comparative method (Glaser & Strauss, 1967) was used by the first author to systematically assign codes to the interview data and documents. In the first analytic sweep, codes drawn from the literature such as stanine and item report (Darr et al., 2007) were applied to data. During a second reading, additional codes such as usual practice / tradition, time constraints and cost of service were induced from data. Following this an examination of codes generated a series of overarching axial codes such as passing stanine scores to management and informing curriculum planning and teaching. These captured the relationship between groups of open codes and their properties. Finally, all codes were assigned to one of the three overarching processes of assessment for teaching and learning: eliciting; analysing and interpreting; and taking action (Cowie & Bell, 1999). This was considered an appropriate way to integrate data and theory, enabling analysis to move iteratively between description and explanation (Ezzy, 2002). The assignment and organisation of codes was checked on a regular basis throughout the process by the second author, with adjustments made where necessary.
Why teachers use PAT:M
The teachers at Matai and Puriri schools used PAT:M because it was a well established and accepted feature of each school’s assessment regime. For each of the six teachers, the test was already in use when he or she came to the school; in Natalie’s words, “we have been using PAT since I was here” (Int.#1, p.3). Further, no-one could remember having been part of any decision-making process about its use, nor were they aware of the reason(s) for their school deciding to use PAT:M, but thought the decision had probably been made by senior management, or the principal, or both. No other rationale, educational or otherwise, was offered in relation to its use. Despite each school’s investment in PAT:M, it seemed the schools’ leaders had a relatively relaxed attitude towards how—and indeed whether—teachers made further use of the information beyond the accessing of stanine scores. Once teachers had passed scores on to management, they were free to further analyse and use information, or not, as they saw fit. As a consequence, an ad hoc approach was apparent in both schools regarding teachers’ analysis, interpretation, and use of PAT:M information at the classroom level, resulting in a number of shortcomings.
While it was intended to conduct two interviews with each teacher (as indicated above), second interviews were not held with Melanie and Lucy from Puriri school and Robert from Matai school. Each of these teachers indicated at the conclusion of the first interview that they did not have any analysed data or reports from PAT:M to share, or evidence that illustrated how they had incorporated information from PAT:M into their planning and teaching. Second interviews were conducted with Natalie and Margaret from Matai school and with June from Puriri school.
Eliciting
Administration of the test in both schools occurred at the beginning of the year, generally at the beginning of March, with Matai school having recently introduced an additional end-of-year administration. All of the teachers could recall having consulted the Teacher Manual (Darr et al., 2007) prior to administering the test at some time, although not necessarily recently: “I can see the manual in my mind so I must have looked way back but [I] probably have not refreshed myself for ten years” (Lucy, Int.#1, p. 6).
The teachers preferred to rely on assistance from colleagues if they had any questions. While teachers knew students could complete the test online, both schools chose pencil and article as their preferred mode of administration. All were aware of the need to “follow the rules” (Margaret, Int.#1, p. 4) when administering and marking the test.
At Puriri school, marking was carried out manually by either the class teacher or the principal. Raw scores were then entered into the school’s computerised management system (eTAP) where they were converted into stanines and a report produced for senior management: “… they [eTAP] worked it out for us, all I enter is the raw score” (June, Int.#2, p.4).
Teachers then filed students’ test papers in an assessment folder. At Matai school either the teacher or teacher-aide had for the past 2 years entered students’ responses from answer sheets into NZCER’s online Marking Service. Once entered, teachers had access to a range of analysed data and reports.
Analysing and interpreting
While only three of the six talked about the ability of the test to provide national, norm referenced information for “comparing your kids … [not just] against each other, [but] comparing them with the bigger groups … with the rest of the country’s kids (Margaret, Int.#1, p. 1) all made reference to the results generating individual student scores in the form of stanines. The three teachers from Puriri school spoke about how information in eTAP was collated and class lists which contained individual student’s raw scores and stanines were produced (see Figure 1).
According to Melanie “the stanine tells what level the students are at, stanine 9 that’s your top, that’s the cream of the cream children” (Int.#1, p. 6) while Lucy stated “anything falling below [stanine] 5 is a concern” (Int.#1, p. 5). In addition to identifying students’ stanine scores, June indicated that as she marked the test papers she kept a note of any “area [of maths] that a lot of them are lacking in” (Int#1, p. 4). No other score or type of report was mentioned by these three teachers.
Like their counterparts at Puriri school, the teachers from Matai placed emphasis on generating individual stanine scores. Margaret knew scores of 8 and 9 indicated students “are doing better [than others in the class]” (Int.#2, p. 1), but Natalie was less sure about stanines 4–7:
I have been told from a 4 up, we should be thinking they’re okay … [but] at a Maths Lead Teacher meeting, they said that if they [students] are not getting a 7 … [this score is] what you consider meeting the standard … (Int.#1, p. 3)
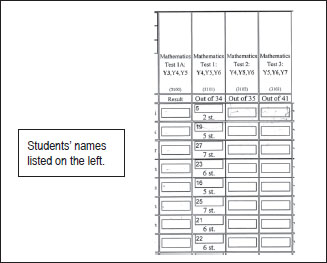
Figure 1. eTAP Class Report: student name, raw score and stanine
Natalie and Robert spoke about how teachers at Matai printed page 31 from the Teacher Manual (Darr et al., 2007) which showed a normal distribution curve, corresponding percentile rank range and stanines (see Figure 2 below). They then recorded two stanine scores on the sheet—one from the current year of testing and one from the previous year so a quick picture of scores over time could be seen. Figure 2 is a report Natalie brought to her second interview, showing her handwritten scores for 2014 (7) and 2015 (5) for one of the students in her class.
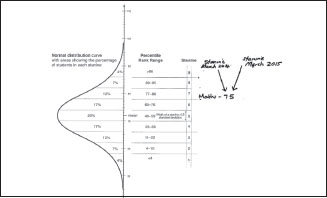
Figure 2. Teacher-devised student report
Although Natalie and Robert indicated this report was used throughout the school Margaret did not make mention of or bring it to her second interview.
Further analysis and interpretation of PAT:M data at Matai school was teacher-specific. Natalie used the NZCER Marking Service to generate a second type of student report for each pupil in her class. As seen in Figure 3, this report contained the student’s raw score, stanine score, patm scale score, and provided a summary of correct and incorrect responses, according to each of the five mathematics strands.
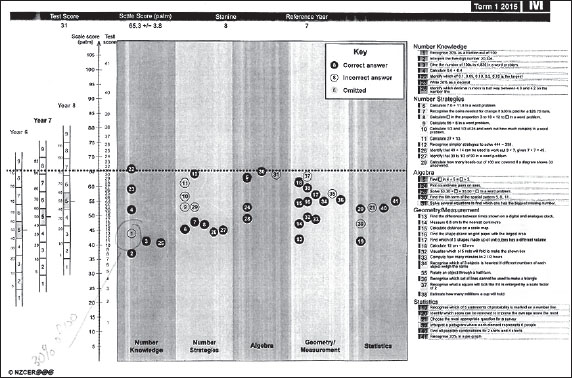
Figure 3. NZCER individual student report
Note. Report shows test score, scale score (patm), stanine, reference year as well as correct and incorrect answers to test questions according to each student
During her interview Natalie talked about the data in this student’s report, saying “so what this is telling me is … he has some good base knowledge but the more complex stuff isn’t there … see [indicating on the report] he’s got very little algebra knowledge …” (Int.#2, p. 1). While acknowledging she needed “to go back really and analyse it [the student’s responses to the 5 algebra items]” (p. 1) there was no mention of drawing on evidence from other sources to support this judgement. In discussing this student’s results, Natalie struggled to make sense of some of the finer details such as the dotted line (indicating the student’s raw score and corresponding scale scores) going across the middle of the report:
What that dotted line should mean, they really should get everything below and they are not really expected to get everything at above, that’s kind of where they should be … [pause/silence] that dotted line doesn’t mean anything to me … (Int.#2, p. 3).
Natalie did not mention or draw attention to the patm score (51) or the standard error of measurement (+-3.3) and when asked, was unable to explain what these meant.
Margaret talked about how over the past 2 years she had downloaded three different types of Marking Service reports. The first was a scale score report:
That’s stanines and they are at the percentage of [pause], so you would have expected 50% of the examples to be in there; 60 in there, 70 in there, 80 and then 90—no, it’s wrong, no, I can’t [work it out] … (Int.#2, p. 1)
The second was an item report:
[The item report] analyses all your different data, different questions, your knowledge, your strategies, all those sorts of things—how well you are going in those particular areas … the green bit, how many have got it right, the yellow bit how many have got it wrong, that’s what I assumed but I don’t know if I know that [is right] … (Int.#2, pp. 4–5)
Finally, Margaret downloaded a class stanine report:
… it’s good for an overall picture where we are at in the class. (Int.#2, p. 6)
While Margaret spoke relatively confidently about the latter report, she indicated the item report was for her the most valuable of the three. In contrast, Robert explained how since the introduction of the NZCER Marking Service “my data has been entered by [a] teacher aide so I just haven’t really found what reports I want back” (Int.#1, p. 7). The only type of report he generated was the school specific, teacher-devised report depicted in Figure 2.
Taking action
Teachers acted on PAT:M information in two main ways: to pass stanine scores to management, and to inform their class-based curriculum planning and teaching. Three further types of action of lesser import were mentioned in passing. The first of these actions—passing stanine scores to management—was enacted in a similar fashion by all six teachers. The second—using information to inform curriculum planning and teaching—was played out in different ways. Further, virtually all actions taken were referenced to, and drew on, the stanine scores of individual students.
To pass stanine scores to management
Irrespective of school, the teachers talked about how they carried out testing using PAT:M so they could provide class lists of students’ stanine scores for senior management, or the principal, or both. Melanie explained, “we forward it [list of stanine scores] to [the maths lead teacher] and [she/he] puts it on a graph and gives it to [the principal]” (Int.#1, p. 7). Robert said, “whatever the management wants, I just pass them the results” (Int.#1, p. 3). Lucy knew her class’s stanine scores were passed on to the principal and was “pretty sure [the principal] collates the information for the Board and he probably does more with the information than what we do” (Int.#1, p. 9). The teachers were unable to be more specific about what happened to the data once it was passed to the principal other than it was shared with the board of trustees and perhaps the Ministry of Education.
To inform curriculum planning and teaching
Three of the six teachers talked about how they used information from PAT:M to inform and adjust their curriculum planning and teaching. As noted earlier, June from Puriri school kept track of students’ responses as she marked the class’s test papers. She then used this information to inform her choice of content area for teaching:
so most of my class got questions 15, 16, 17 and 18 - so these statistics questions … they had to read a graph ... over half got all of them wrong so they didn’t know how to pull the data from the graph, so that [was] why I would have planned statistics [showing planning overview for the term] straight away. (Int.#2, p. 1)
At Matai school, Margaret indicated she drew on data from Item Report analyses—however as noted earlier she had difficulty interpreting this information. Natalie used information from student reports to pinpoint areas needing more attention at the class or group level:
I might look [at the reports] and think … a lot of the kids have problems with algebra … so we might have to do more on that than I would normally do with a different class. (Natalie, Int.#2, p. 4).
June and Melanie from Puriri spoke about how they used stanine scores to confirm or change mathematics instructional groups. Following testing, Melanie used the PAT:M stanine score in conjunction with assessment data from other tools to form her teaching groups:
We enter the raw score and it turns into a stanine, and with me, what I’ve done, I put that with all my children’s test results. As you look along, it forms your groupings. (Int.#1, p. 6)
June explained how after administering PAT:M in March she “changed [her class] grouping in term two” (Int.#2, p. 4). She talked about how a low stanine for one student had alerted her to “have another look to see if there’s something else going on” (Int.#2, p. 2. In this instance she looked at assessment data from other maths tools, consulted a colleague, and talked with the student concerned before changing his instructional group and referring him for extra assistance. Lucy from Puriri school talked in more general terms about how stanine scores were used to make decisions about who would benefit from extra assistance or extension work.
Following PAT:M testing at Matai school, Natalie used stanine scores to confirm group membership. In addition, in some cases she compared past and current stanines and made changes to group membership:
so in this case [showing student’s report] last year they were [stanine] 5, this year they are 7, because of that … moved from my lower group, was moved up. (Int.#1, p. 2)
Natalie spoke of instances where students’ stanine scores made her “look harder” and “the result made me think … and see what’s going on” (Int.#1, p. 2) before confirming or changing group membership. She also used analysed information to identify mathematical areas of strength and weakness in relation to individual students, consulting student reports generated through the NZCER Marking Service to get an overall picture of each child’s “knowledge, their strategy, their strand … [to see] where they’ve got holes, where they’ve got obvious issues … [showing report] strong in statistics… they don’t need [to be taught] that because I know they’ve already got that sorted, so we won’t do that bit” (Int.#1, p. 4). This information was used to inform decisions around her planning and teaching, and the formation of instructional groups.
Additional uses of stanines
Two teachers, one from each school, mentioned how they used stanine scores from PAT:M to inform their Overall Teacher Judgements (OTJs) as part of National Standards reporting: “[stanines] are used to identify those who are not going to meet national standards and those who exceed” (Lucy, Int.#1, p. 9).
Using stanines to track student progress over time was specific to two teachers at Matai school. Natalie used the individual report sheet printed from the Teachers Manual and her handwritten entry of stanine scores “to see if there’s a big difference between last year and this year’s result” (Int.#1, p. 6). She explained this was a personal use of the data, not one prescribed by the school. Margaret also liked to use stanines to track student progress, observing that if a student had dropped two stanines “you don’t really know why, but you try and fix it” (Int.#1, p. 6). Neither teacher made mention of triangulating the stanine score with information from other sources when making judgements about progress.
Each of the teachers at Matai school spoke about how they shared results from PAT:M with parents. Prior to the first parent–teacher conference of the year, Robert and Natalie printed page 31 from the Teacher Manual (Darr et al., 2007) and used this to show parents the relative level of their child’s achievement:
At the beginning of the year when I’m meeting with parents we discuss the PAT results. I put them on a graph [indicates the bell curve] because it’s a traditional thing, parents like to compare their children against children … that age group, across the country. (Robert, Int.#1, p. 7)
Natalie also used this report to talk with the parent(s) about any shifts over time in a student’s stanine scores: “we could discuss what that may mean or may not mean for this student” (Int.#1, p. 2). June explained that reporting stanine scores to parents at Puriri school occurred when results were to be used for a specific purpose such as offering those with stanine scores of 8 and 9 the opportunity of participating in the New South Wales mathematics competition. In such circumstances the school sent the parents a letter and offered to pay the entry fee for the competition.
Making full use of information from PAT:M
Teachers at both schools indicated they were probably not making the most, or full, use of the data available from PAT:M. Margaret acknowledged near the end of her first interview that she was not drawing on NZCER’s reports “as much as [I] should” (Int.#1, p. 6), a view echoed by her two colleagues. Despite the NZCER Marking Service being “more helpful … [as it] collates it all, spits it back and gives you whatever you want … it’s time saving and it’s accurate” (Margaret, Int.#1, p. 3) the three teachers at Matai school felt that after 2 years of use they were only just scratching the surface in terms of information available. Natalie was “just finding my way around [it] really” (Int.#1, p. 8), stating “some of the reports are really difficult to print” (Int.#2, p. 5) and she did not have the time to spend working through the vagaries of the system. The array of reports was still “sort of new” (Int.#1, p. 9) to Robert. He was aware his colleagues printed a number of reports from the Marking Service but felt this was not necessary as other assessments provided him with sufficient information:
It’s a bit of a double up because we are doing GloSS … IKaN, and we are doing all these other assessments on different strands [and] I’m thinking I’m getting enough information. (Int.#1, p. 8)
He did not find PAT:M particularly useful and confessed to being “anti-assessment” (Int.#1, p. 7), particularly in relation to the use of standardised tests.
Lucy, whose school did not use NZCER’s Marking Service, was aware from her experience at another school that “[more] information is available” (Int.#1, p. 8). One of her reasons for not analysing data in more depth related to having ample information from other sources:
we have e-asTTle which I find really beneficial, the information you get there is great … GloSS is amazing because you can be one-on-one and you can see what’s happening and from there you can be really informed [for] your planning … IKaN, again that’s great, it gives you knowledge and ideas where the gaps are … (Int.#1, p. 3).
This sentiment was echoed by others. Melanie found information from other maths assessments such as GloSS more helpful than PAT:M because “it [GloSS] tells you the strategy they are at, the thinking they do and also gives me an idea how much time it takes them to figure it out …” (Int.#1, p. 4). She also spent more time looking through students’ results and analysing these at her last school while “here [at Puriri school] we tally the results and look more for the stanine to confirm groupings, it’s not much more than that” (Int.#1, p. 3). Following school practice was also mentioned by Lucy as a reason for not analysing her PAT:M data any further: “we [teachers at Puriri school] stop once we’ve got the stanine scores” (Int.#1, p. 8).
By their own admission, teachers in the present study were not making full use of the data available. More concerning however was the questionable nature of some of the uses of the PAT:M information—for example, the reliance on stanines as an indicator of student progress over time; making judgements about students’ mathematics content knowledge (e.g., algebra, statistics) on the basis of a small number of items in PAT:M and without reference to other sources of information; being unsure about how to interpret reports, yet using these to inform curriculum planning and teaching.
Limitations of the study
Findings from this study need to be considered with reference to two limitations. In the first instance, the study involved only two schools from the same geographic area, each represented by three teachers. Assessment practice varies between schools and among teachers. Schools that use NZCER’s Marking Service, for example, may have similar or different experiences to those outlined above (see for example NZCER 2012); and teachers may engage more deeply with data from PAT:M in schools where school leaders are actively involved in analysing and interpreting PAT:M data and in designing appropriate responses to this data with staff. In the second instance, the current study did not address how the schools’ principals or members of the management teams analysed, interpreted and used PAT:M results. As signalled by Dunn and Marston (2003a; 2003b), it may be that PAT:M has a greater role to play (in some schools) at the management rather than the classroom level.
Discussion
Over time Matai and Puriri schools had allocated money and time to the PAT:M assessment tool. The effort and resources invested in such tasks can however “only be justified if the assessment leads to worthwhile benefits for students or other stakeholders” (Crooks, Kane & Cohen, 1996, p. 279). Findings from the present study showed that irrespective of whether the school used NZCER’s Marking Service, the data elicited through this test was neither fully analysed nor was it used to its fullest extent by the classroom teachers—an outcome reminiscent of ERO’s finding that Years 4–8 teachers used mathematics assessment tools to “collect data but it was not used to its full potential” (2013, p. 18). Moreover, teachers at both Matai and Puriri knew they were not making the most of the information they had available.
A focus on individual stanine scores
As stanine scores were readily available, teachers drew on these to make a range of decisions about individual students. Each teacher was reasonably confident in her or his ability to grasp the meaning of these scores, in particular scores at the higher (8–9) and lower (1–3) ends of the scale, with some indecision around the meaning of mid-range scores. The teachers’ appropriately used stanines to alert them to students who would benefit from additional help and/or extension, those who would need further assessment, and also to inform OTJs.
It appeared the teachers in this study were unaware of the relatively coarse nature of stanines and the impact this can have on their interpretation and use of data. For example, when the teachers talked about how they used stanines for creating instructional groups they did not seem to realise it is possible for two scores in the same band (e.g., a score at the start of stanine 5 and another at the end of stanine 5) to be further apart than two scores in adjacent bands (e.g., a score near the end of stanine 4 and another at the start of stanine 5). This raises questions about whether students in the same stanine band are best placed in the same instructional group. Such placement is based on the assumption that those within a single band will have similar learning needs (Gipps, 1994). As PAT:M provides a broad assessment of knowledge, understanding and skills across five content areas, students within the same band may have learning needs in quite different content areas. Faulty interpretations can have significant consequences for students, particularly if stanine scores are the sole or principal point of reference when making important decisions. Use of stanines as indicators of student progress over time is also problematic. It is stated quite clearly in the Teacher Manual that “when differences in stanines are interpreted for individual students, the scores must differ by [at] least two stanines before any difference can be seen as significant” (Darr et al., 2007, p. 30). A student making expected progress will therefore most likely have the same stanine score from one year to the next.
Use of stanines to track progress is no longer recommended for PAT:M as the patm scale score has been developed specifically for this purpose (Darr et al., 2007). Even though they had been using the revised PAT:M test since at least 2007, none of the teachers had heard of the patm score. This finding suggests that rather than being familiar with new features in the revised version, teachers were relying on the “tried and true” stanine and time-honoured practice. Clinging to the familiar like a much-loved garment, even when the familiar is not particularly appropriate, is arguably all too true of many aspects of educational assessment (Broadfoot, 2001). This may also explain in part why some teachers did not make full use the reports available through the NZCER Marking Service, or the Teacher Manual (Darr et al., 2007), or both.
Four of the six teachers seemed to place little value on, and saw little need to delve deeper into, the PAT:M data beyond the accessing of stanine scores. The individual student report was available through the Teacher Manual (Darr et al., 2007) to teachers at Puriri school, and all other reports were available through the NZCER Marking Service to teachers at Matai school. Only two of the teachers from the latter school talked about how they understood and used these PAT:M reports, with both having some difficulty interpreting the finer points on these documents. It does not matter how sound an assessment has been up to the point of analysis and interpretation, “validity can be seriously undermined if the person evaluating the assessment information does not properly understand the information” (Crooks et al., 1996, p. 276). The ability to make valid interpretations from standardised, norm referenced tests requires considerable levels of teacher knowledge and skill (Parr & Timperley, 2008). When writing about threats to the valid interpretation and use of assessments, Crooks et al. (1996) observed:
The danger of misinterpretation is probably greatest where the person interpreting the assessment information has not been involved in designing the assessment. No matter how thorough and accurate the interpretive guidelines available (in a test manual or elsewhere), they do not help if they are not carefully read and understood. This issue deserves particular consideration when classroom teachers are making use of the results of standardised tests … (p. 276, emphasis added)
The PAT:M Teacher Manual (Darr et al., 2007), available to teachers at both schools, provides information about the types of analyses and reports available and also explains and illustrates how teachers can interpret and use information from these reports. As some of the teachers in the current study did not appear to place great value on the PAT:M information, they possibly did not see a need to consult the manual. Alternatively, they may have opened the manual but were daunted by the nature of the information. Whatever the reason, it was clear that if assistance was needed, teachers preferred to rely on colleagues and past experience rather than read the manual.
The level of analysis and understanding of data evident in the current study, or lack thereof, raises questions not only about the validity of interpretations, but also about the state of the six teachers’ assessment literacy. Assessment literate teachers possess “knowledge about the basic principles of sound assessment practice, including its terminology, the development and use of assessment methodologies and techniques, and familiarity with standards of quality in assessment” (Te Kete Ipurangi, 2016). They gather dependable information, can aggregate and analyse it, and use it to further teaching and learning. Dealing with the data from assessment tools such as PAT:M can however be “daunting and requires teachers and school managers to be confident in their assessment literacy” (Darr, 2006, p. 48). Teachers have found it challenging to take information from standardised assessment tasks and make concomitant teaching decisions (Parr & Timperley, 2008).
A further possible reason contributing to the teachers’ apparent inability to analyse and interpret PAT:M data may ironically lie in the support available. Firstly, as most of the teachers did not mark their students’ papers they were not necessarily fully aware of individual and class nuances in the results. Secondly, as the teachers used either eTAP or NZCER’s Marking Service to analyse data, they had little need to refer to the tables in the Teacher Manual (Darr et al., 2007) for converting test scores to scale scores. They would not therefore have directly encountered the patm score or the associated notion of measurement error. More concerning, however, was the presence of a patm score and the standard error of measurement at the top of the student report used by two of the teachers. It seems that these teachers had either overlooked or ignored this information, their attention firmly fixed on the stanine score. As a consequence of using computerised systems, the teachers at Matai school may have lost a willingness or ability (or both) to analyse and engage with assessment data from standardised tests. When teachers are stripped of the need to think and process information, they quickly become deskilled (Darling-Hammond, 2004). Although it is important to support teachers, the provision of computerised services may unintentionally contribute to a loss of the aspects of assessment literacy needed for the interpretation and use of such information.
A lack of focus on aggregated data
The discourse of teachers at both schools focused on how they used information from PAT:M to make decisions about individual students. If they did draw on data to make decisions about group or class areas of need, these tended to be based on a cursory consideration of student reports across the class, where broad areas of the curriculum needing further attention were identified. There was no evidence of any fine-grained, considered analyses and/or interpretations of aggregated data at the group or class level. Moreover, no mention was made of their having collectively analysed and interpreted PAT:M data at the cohort or school level to review and identify strengths and weaknesses of the mathematics programme. It has been reported that teachers tend to see little value in aggregated data from standardised assessment tasks, associating such tasks and the aggregation of data with reporting and accountability (Harris & Brown, 2009; Robinson, Phillips & Timperley, 2002), responsibilities that rest with school principals and boards of trustees. Standardised tests are often disliked by teachers and perceived as having little educational benefit for students (Harris & Brown, 2009)—they place more value on anecdotal, observational information (Dunn & Marston, 2003b; Symes & Timperley, 2003) and attend to information at the level of the individual student (Robinson et al., 2002). Primary school teachers tend also to be unaware of how such data might be used on a wider scale, at a class, cohort, and/or school level, to more effectively target teaching and learning programmes (Symes & Timperley, 2003; Timperley & Parr, 2008).
Information elicited from standardised assessment tasks has a role to play in programme evaluation and improvement at the class, cohort, and/or school level (Education Review Office, 2011: Ministry of Education, 2011; Timperley, 2009). The premise of school improvement is that assessment should enhance teaching quality and, as a corollary, student learning (Timperley, 2005; 2009). In recent years, teachers in New Zealand primary schools have been actively encouraged to use reliable and trustworthy assessment information from standardised assessment tasks to evaluate the effectiveness of their programmes (Education Review Office, 2011: Ministry of Education, 2011) and, through teaching as inquiry, to “improve outcomes for students through purposeful assessment, planned action, strategic teaching, and focused review” (Ministry of Education, 2011, p. 1). When data are aggregated and evaluated at the class, cohort and/or school levels, links can be drawn between student achievement and the particular teaching approaches and programmes students have experienced (Robinson et al., 2002). Evidence-based decisions can then be made on the basis of analysed information with a view to adjusting teaching strategies, enhancing programmes and improving student outcomes. None of the teachers in the present study referred to having used PAT:M data in this manner.
School leaders have a major role to play in addressing shortcomings such as those displayed by the teachers in this study. According to Brown (2015) “large learning gains have been documented when school leaders are actively involved in collecting and evaluating assessment data and in designing and monitoring pedagogical responses to assessment results” (p. 70). Rather than being left to chance, as in the current study, school leaders and teachers should jointly review achievement data available from tests such as PAT:M to identify and address strengths and weaknesses in student performance and in the pedagogical and assessment knowledge bases of teachers (Parr & Timperley, 2008). Collaboration between leaders and teachers in the analysis, interpretation, and use of data in ways that transform student learning and achievement should be the norm rather than the exception (Brown, 2015).
Conclusion
Assessment can be a powerful tool when teachers are able to analyse and interpret information in ways that enhance their teaching and programmes, and as a consequence, support and improve students’ learning. As evident in this study, leaving the interpretation and use of data to the discretion of individual teachers is risky, given their reluctance to interpret and make full sense and use of the information. A systematic and planned school-wide approach to the analysis, interpretation and use of data is needed if learners, teachers, schools, and other stakeholders are to get full value from and make the best use of information from PAT:M. This is not the responsibility of teachers alone—school leaders have a pivotal role to play in creating the kinds of organisational conditions in which learning from assessment data becomes an accepted and integral part of teachers’ practice (Timperley, 2009).
References
Berg, B.L. (2009). Qualitative research methods for the social sciences. Boston: Allyn & Bacon.
Braun, V. & Clarke, V. (2013). Successful qualitative research: A practical guide for beginners. London: Sage Publications.
Broadfoot, P. (2001). Editorial: new wine in old bottles? The challenge of change for educational assessment. Assessment in Education, Principles, Policy & Practice, 8(2), 109–112. http://dx.doi.org/10.1080/713613377
Brown, G. T. L. (2015). Leading school-based assessment for educational improvement: Rethinking accountability. Rassegna Italiana di Valutazione 19(61), 70-81. http://dx.doi.org/10.3280/RIV2015-061005
Cowie, B., & Bell, B. (1999). A model of formative assessment in science education. Assessment in Education, Principles, Policy & Practice, 6(1), 101–116. http://dx.doi.org/10.1080/09695949993026
Crooks, T.J., Kane, M.T, & Cohen, A.S. (1996). Threats to the valid use of assessments. Assessment in Education: Principles, Policy & Practice, 3(3), 265–286.
http://dx.doi.org10.1080/0969594960030302
Darling-Hammond, L. (2004). Standards, accountability, and school reform. Teachers College Record, 106(6), 1047–1085.
Darr, C. (2006). Frequently asked questions about assessment. Set: Research Information for Teachers, 2, 47–48.
Darr, C., Neill, A., & Stephanou, A. (2007). Progressive achievement test: Mathematics— Teacher manual (2nd ed). Wellington: NZCER Press.
Dixon, H., & Williams, R. (2003). Formative assessment and the professional development of teachers: Are we focusing on what is important? Set: Research Information for Teachers, 2, 35–39.
Dunn, K., & Marston, C. (2003a). What tools and strategies do teachers use to assess year 5, 7 and 9 students in English and mathematics? Set: Research Information for Teachers, 2, 40–43.
Dunn, K., & Marston, C. (2003b). How useful do teachers find the tools and strategies they use for assessing English and mathematics at years 5, 7, and 9? Set: Research Information for Teachers 2, 44–48.
Education Review Office (2011). Directions for learning: The New Zealand curriculum, principles, and teaching as inquiry. Retrieved from http://www.ero.govt.nz/index.php/National-Reports/Directions-for-Learning-The-New-Zealand-Curriculum-Principles-and-Teaching-as-Inquiry-May-2011
Education Review Office (2013). Mathematics in years 4 to 8: Developing a responsive curriculum. Retrieved from http://www.ero.govt.nz/National-Reports/Mathematics-in-Years-4-to-8-Developing-a-Responsive-Curriculum-February-2013/Foreword
Ezzy, D. (2002). Qualitative analysis: Practice and innovation. St Leonards, N.S.W.: Allen and Unwin.
Gipps, C. (1994). Beyond testing: Towards a theory of educational assessment. London: The Falmer Press.
Glaser, B.G., & Strauss, A.L. (1967). The discovery of grounded theory: Strategies for qualitative research. New York: Aldine de Gruyter.
Harris, L.R., & Brown, G.T.L. (2009). The complexity of teachers’ conceptions of assessment: Tensions between the needs of schools and students, Assessment in Education: Principles, Policy & Practice, 16(3), 365–381. http://dx.doi.org/101080/09695940903319745
Hattie, J., & Timperley, H. (2007). The power of feedback. Review of Educational Research, 77(1), 81–112. http://dx.doi.org/10.3102/003465430298487
Hawe, E., Dixon, H., Williams, R., & Tuck, B. (2003). School entry assessment tasks: Why do teachers use them—or not? Set: Research Information for Teachers, 2, 18–22.
Joyce, C. (2006). Which assessment tool? Set Research Information for Teachers, 1, 52.
Lincoln, Y. S., & Guba, E. G. (1985). Naturalistic inquiry. Newbury Park, CA: Sage Publications.
Ministry of Education. (2011). The New Zealand Curriculum update, (12, August), 1–4.
Neill, A. (2015). A new era for PAT Mathematics: Online, interactive, and adaptive. Set: Research Information for Teachers, 2, 60–63.
New Zealand Council for Educational Research. (2012). User feedback on the NZCER Marking Service. Retrieved from http://www.nzcer.org.nz/system/files/SurveyReport2012.pdf
Parr, J. M., & Timperley, H. S. (2008). Teachers, schools and using evidence: Considerations of preparedness. Assessment in Education: Principles, Policy and Practice, 15(1), 57–71.
Robinson, V., Phillips, G., & Timperley, H. (2002). Using achievement data for school-based curriculum review: A bridge too far? Leadership and Policy in Schools, 1(1), 3–29.
Shulman, L. S. (1987). Knowledge and teaching: Foundations of the new reform. Harvard Educational Review, 57(1), 1–22.
Symes, I. & Timperley, H. (2003). Using achievement information to raise student achievement. Set: Research Information for Teachers, 1, 36–39.
Te Kete Ipurangi. (2016). Assessment online, assessment literacy. Retrieved from http://assessment.tki.org.nz/Assessment-in-the-classroom/Assessment-for-learning-in-practice/Assessment-literacy
Timperley, H. (2005). Instructional leadership challenges: The case of using student achievement information for instructional improvement. Leadership and Policy in Schools, 4(1), 3–22.
Timperley, H. (2009, August). Using assessment data for improving teaching practice. Paper presented at the ACER Research Conference, Perth, Australia.
Torrie, P. A. (2012). Factors impacting teachers’ analysis, interpretation and use of formal reading assessments: PAT, PROBE and asTTle. Unpublished master’s thesis, The University of Auckland. Retrieved from https://researchspace.auckland.ac.nz/docs/uoa-docs/rights.htm
The authors
Amanda Caldwell is a teacher at Onewhero Area School. For the last 3 years she has been part of a Ministry of Education initiative, Accelerating Learning in Mathematics. Her post-graduate study in the teaching of Mathematics has sparked an interest in assessment as a tool to inform learning and teaching. The research undertaken into teacher use of the PAT Mathematics was completed as part of her Master of Professional Studies in Education degree at The University of Auckland.
Eleanor Hawe (corresponding author) is a principal lecturer in the Faculty of Education and Social Work at The University of Auckland. Her research focuses in the main on assessment for learning—more specifically, goal setting, feedback (including peer feedback) and the development of students’ evaluative and productive expertise across a range of educational contexts (including tertiary education) and teaching subjects.
Email: e.hawe@auckland.ac.nz