Transnumerative thinking: finding and telling stories within data
Helen L. Chick, Maxine Pfannkuch, and Jane M. Watson
Abstract
A critical component in the development of students’ statistical thinking and reasoning is transnumerative thinking; that is, changing representations of data to engender an understanding of observed phenomena. Examples from Years 6 to 9 New Zealand students’ and Australian students’ representations of data from a given multivariate dataset are described. Their representations are discussed in terms of their developing abilities to explore data and unlock the stories contained therein. The implications of changing the focus of statistics instruction and the curriculum from merely teaching students how to construct graphs to exploring and representing patterns and relationships in data are presented.
Introduction
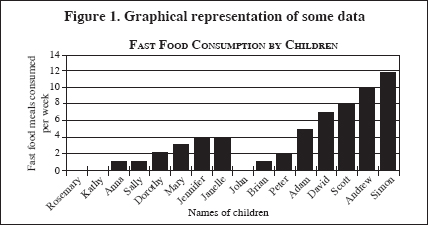
What do you think the graph in Figure 1 is telling us? Is it helpful to know that the children on the left are girls and that the group on the right is made up of boys?
Does Table 1 contain the same data? Does it tell the same story? How does it differ from the graph?
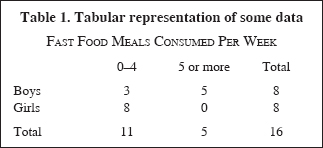
Which representation better tells the story: the graph or the table? Why? What might the data have looked like before they were turned into a graph or a table? Are there other ways of showing the data? Would these tell the same story? How can we tell the story clearly?
Collecting and exploring data in order to answer questions of interest is an important component of statistical learning. Given a dataset, then, what can we do with it in order to reveal the answers or stories that are hidden within it? Messages are not always easy to see in raw data, and so strategies for making those messages visible are important. Such strategies involve analysing and representing the data in ways that show the outcomes clearly. The two examples above demonstrate that there are different ways of representing data, but that some approaches may be better than others for revealing the stories within them. The graph, for instance, allows a visual comparison of the two groups—the striking contrast between its two halves clearly shows the difference between the girls’ and the boys’ fast food consumption. The table, on the other hand, also presents the contrast between the boys’ and girls’ data, but here this contrast is not as visually obvious as in the graph. Nevertheless, the table summarises the data better, and would be well suited to displaying larger datasets.
The process of deciding what to do with a dataset in order to represent it is critical. There has been considerable emphasis on ensuring that students can interpret data in an already existing representation, often focusing on students’ ability to read data and read beyond the data, as suggested by Curcio (2001). In contrast, it appears to be more difficult to create successful representations that reveal stories within data (Chick & Watson, 2001). Even for adults, producing good representations of data is difficult. There are numerous examples in the media of poorly designed representations, including some that are actually wrong or misleading. The process of going from a raw dataset to a representation that reveals and provides evidence for the “story within” is, apparently, challenging.
Part of the problem is that the curriculum has emphasised univariate datasets and the construction of conventional statistical graphs, but without emphasising the actual purpose of statistical exploration. For many students, graphs are illustrations rather than reasoning tools to detect patterns and unlock the information contained in the data. Furthermore, the emphasis on univariate datasets has prevented students from observing differences and relationships between variables and realising that the purpose of statistical investigations is to seek explanations, to make predictions, and to explore new contextual knowledge. Instruction has focused on how to draw graphs. It now needs to focus on how to represent, explore, and think with data. The development of students’ statistical thinking, reasoning, and literacy is an emergent research area (Ben-Zvi & Garfield, 2004) and has been recommended as a major focus of the New Zealand mathematics curriculum for the 21st century (Begg & Pfannkuch, 2004).
The curriculum and statistical thinking
The question “What is statistical thinking?” has provoked considerable debate among statisticians and, more recently, among statistics education researchers. In the debate the central element of all the definitions is an understanding of variation, which Moore (1990) describes as being a structure of thought that whispers “variation matters”. Wild and Pfannkuch (1999) identified five elements that they believe are fundamental to statistical thinking in empirical enquiry in all fields:
•&;&;&;&;recognition of the need for data;
•&;&;&;&;transnumeration (the focus of this article, and defined shortly);
•&;&;&;&;consideration of variation;
•&;&;&;&;reasoning with statistical models; and
•&;&;&;&;integrating the statistical and the contextual.
Any curriculum area that is concerned about reasoning from data would need to promote these five fundamental elements of statistical thinking. Since so many curriculum topics involve rich and complex data that students need to understand, question, and hypothesise about, it is important for all educators to consider how these five elements of statistical thinking can be developed in students. It is also important to ask whether these elements are unique to statistical thinking and whether other curriculum theorists have discussed similar types of thinking as being essential across curricula. Since this article is concerned with only one of these elements, transnumeration, consideration is given to how this element may encapsulate a type of thinking that is essential for reasoning from data, but has not yet been a feature of the mathematics curriculum or other curricula.
Within mathematics education generally, reasoning with multiple representations—for example, the graphs, tables, and equations of algebra—is considered an important facet in developing mathematical thinking. Working mathematically involves recognising, flexibly manipulating, and transforming mathematical ideas within and between a variety of qualitatively different representational systems. Wild and Pfannkuch (1999) claim statistical thinking involves more than reasoning with and interconnecting multiple representations. To capture this difference they coined the word transnumeration. It is a type of thinking that enacts capturing, creating, defining, and changing measures and representations in order to seek meaning from and to learn about observed phenomena. It also involves organising, reducing, and summarising data, and recognising that many representations are necessary for understanding the real-world situation and detecting stories in the data. If we consider the real system— a real-world situation which we are seeking to understand—and the statistical system—the data-based representation of our real situation— then transnumeration-type thinking occurs through:
•&;&;&;&;capturing measures of the real system that are relevant;
•&;&;&;&;constructing multiple statistical representations of the real system; and
•&;&;&;&;communicating to others what the statistical system suggests about the real system.
Since the teaching of reasoning from data is prevalent in many disciplines (such as the social sciences, biological sciences, and commerce), transnumeration may be an element of thinking that needs to be addressed in these curricula.
What, then, are some of the issues that need to be considered and taught explicitly in order to develop this important skill of unlocking the stories contained in data? In this article we begin to look at this question through an examination of students’ work samples as they attempt to find and convey stories from within a small dataset.
Key issues in transforming and representing data
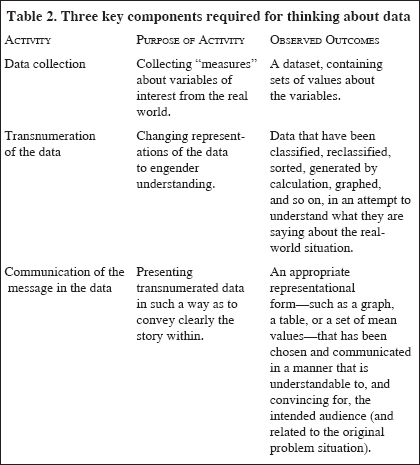
In carrying out a statistical investigation there are a number of key activities relevant to analysing and answering questions about the real world. Three of these important steps, mentioned in the previous section, are summarised in Table 2. The first—important in the curriculum, but not a focus of this article—is data collection: ensuring that the correct information is gathered using measures that allow meaningful analysis. The second step involves taking the resulting dataset and searching for the message within. This is where transnumeration comes into play: Wild and Pfannkuch (1999) define this as “changing representations to engender understanding” (p. 227). Transnumeration involves reorganising and calculating with the data, so that the result reveals what the data are really saying. Some examples of transnumeration include taking data about favourite television shows and grouping them into categories such as comedies and drama, or producing a box-plot for a set of numerical values. Some transnumerative techniques may be more sophisticated than others, but they are characterised by taking some or all of the data and changing the representation of those data in some way.
Finally, having found the message, we need to communicate it to others in a way that is convincing. This may be a graph, a set of mean values, or a confidence interval; in short, some depiction of the data that successfully tells the story to the audience. The transnumeration phase may result in various representations of the data, but the key aspect of the communication phase is to choose the best representation for telling the story. These three steps—data collection, transnumeration, and communication—are essential in investigating and answering questions about the real world.
In our search for stories within data we may carry out many transnumerative processes. These might include sorting data, tallying data, sketching simple frequency tables, plotting scatter graphs, calculating correlation coefficients, conducting i-tests, determining means, grouping data, and so on—all in an attempt to find and be convinced about the messages buried in the raw data. In some cases transnumeration creates new variables, such as new categories (e.g., by grouping data) or means. These new variables then contribute to further analysis of the data. Transnumeration may also involve compression of the original data, as in the calculation of the single value of a mean from several data values, or the construction of a table of grouped data (such as Table 1). We may not know in advance which transnumerative techniques are going to be more useful, although we may be guided by the questions we are investigating and the types of data. Our capacity to undertake transnumeration is also constrained by the statistical tools in our repertoire: the more tools we have at our disposal, the more techniques we can apply in our search for the data’s stories.
One of the important purposes of statistics is to provide evidence to others for stories that are contained within datasets, hence the essential communication phase. Students need to understand that claims about data ought to be supported by some form of convincing evidence. A scatter graph, for example, can show the trend (or lack) of an association; whereas means and box-and-whisker plots allow comparisons of groups of data. Not only should the representations used for effective communication be technically correct, with labelled axes or appropriately presented confidence intervals, but they should also convey clearly the stories in the data to the audience.
As will be seen in the student work samples, there are aspects about data that can make choosing suitable representations difficult. Different data types offer different challenges: categorical data may be difficult to order, whereas numerical data may be hard to group. Moreover, students may not realise that the techniques of ordering and grouping can produce more effective representations. Students are also challenged by the move from univariate data to multivariate data and the idea of dealing with association. Finally, students have to grapple with the ambiguity arising from variation in the data. This variation clouds the message, making the story in the data more difficult to see.
Examples using the Data Cards Protocol
The student work samples to be presented in this section show student understanding of transforming and representing data, and were produced when students were asked to explore a particular small dataset. These samples arose during various studies by the authors (Chick & Watson, 2001; Pfannkuch & Rubick, 2002; Watson & Callingham, 1997; Watson, Collis, Callingham & Moritz, 1995), in which students worked on the Data Cards Protocol (described below) in pairs or threes in classroom or interview settings. The students were in Years 7 and 8 in New Zealand and Years 6, 7, 8, and 9 in Australia, allowing us to focus on the types of transnumeration and representation used by middle-school students with limited formal training in statistics.
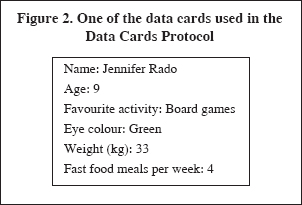
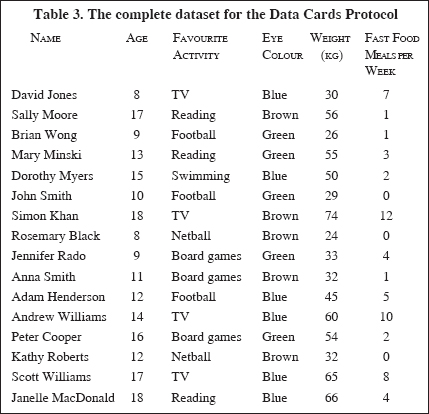
The Data Cards Protocol (Watson et al., 1995) uses a set of 16 cards, each bearing the name, age, weight, weekly fast-food consumption, favourite activity, and eye colour for a fictitious young person. A sample card is shown in Figure 2 and the entire dataset is given in Table 3. Students working with the data cards are asked to look for and show any interesting features of the data. This open-ended task allows students to explore a variety of questions using numerous possible approaches. The dataset contains both categorical and numerical data, and allows consideration of questions involving single and multiple variables, and association among variables.
An overview of students’ interactions with the dataset
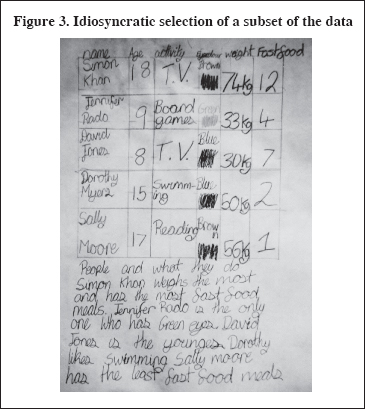
A multivariate dataset, such as that in the Data Cards Protocol or any similar complex data arising from actual data collection, provides students with opportunities to explore data and to become data detectives, hypothesis generators, corroborators of conjectures, and discoverers. Given a particular dataset, there are three stages through which students must progress in order to successfully find and display the stories therein. First, they need to understand the data, identifying the variables that are present. In the case of the Data Cards Protocol, students must also recognise that, whereas there are data about each child on each individual data card, the whole dataset involves all the data on the complete set of cards. The transition from focusing on individual data points to considering the dataset as a whole is particularly critical, with many younger students able only to acknowledge single features, such as that Simon Khan eats lots of fast food, or idiosyncratic groups of data, as seen in Figure 3.
Once students appreciate the importance of examining the whole dataset, the second step is to transnumerate the data in a way that starts revealing the stories within. The heart of statistical analysis is to gain information about the whole group, or to find the “signal” among the “noise” (Konold & Pollatsek, 2002). Because there are so many variables in the Data Cards Protocol’s dataset, there is wide scope for student choice about what aspects to examine.
The final stage involves making decisions about what to represent or calculate in order to communicate the story. This may involve calculating summary statistics (such as means) or drawing a graph. The process of deciding how to transnumerate and represent the data is a key factor in whether students will be successful in gleaning relevant information from the data in order to tell a story. Moreover, the kind of story that needs to be told will affect what transnumeration needs to take place. The examples in the following sections illustrate these ideas.
Dealing with single variables: categorical and numerical data
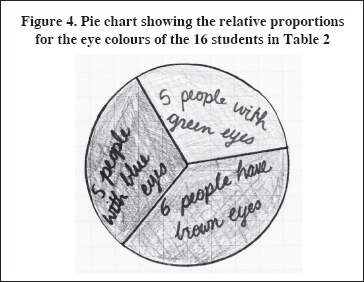
Many students using the Data Cards Protocol focus first on a single variable. Indeed, many of the data tasks that students encounter at school involve only a single variable, so students are familiar with such situations. Dealing with categorical variables—such as “eye colour” or “favourite activity”—is often easy, since data can be transnumerated by calculating frequencies and then represented by the data using a bar graph or a pie chart (see Figure 4). Such transnumeration allows us to tell the story of which categories occur more frequently, and to make comparisons among categories.
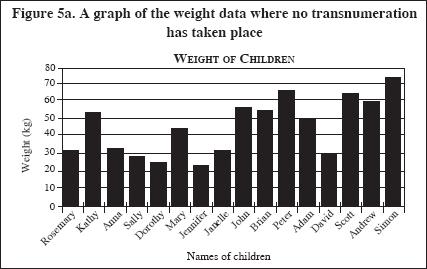
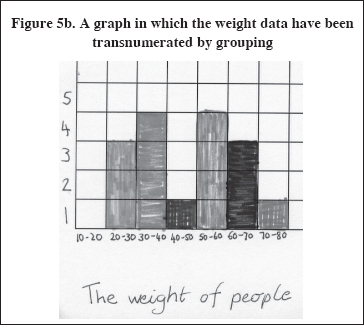
In contrast, numerical data can be more difficult to manage, because it is not always obvious how to transnumerate them. Figure 5(a) is an example of when a graph merely duplicates the data, with no further transnumeration. We can still find the weight of an individual, but we learn no more than if we had looked at the original weight data: there is no deeper story revealed about “weight”. To say something more about the weight of people in this dataset, students might classify the data into groups, as in Figure 5(b). This is not an easy process, as the names of individuals must be suppressed and a new categorical variable—“weight interval”—needs to be identified and created from the numerical variable “weight”. Once the weight intervals have been created, and tallying or sorting occurs, the table is changed into another representation—a graph—to communicate the information contained in the data and to allow further interpretation. From the representation in Figure 5(b), information about the distribution of the weights of people can be extracted, including some information about the “centre”, the spread, and proportions above or below a specified value. These acts of creating, thinking about, and selecting new representations comprise transnumerative thinking. The ability to squeeze, reduce, and summarise large amounts of information is crucial to statistical reasoning in many curriculum areas.
Dealing with multiple variables: comparisons and associations
Considering univariate data, however, gives students little understanding of one of the main purposes of statistics, which is to compare data, find relationships, and hypothesise about possible causes. The ability to deal with multivariate data and consequently understand associations among variables is important for statistical literacy. The teaching of these topics is often delayed until late high school, yet younger students can comprehend aspects of association. The Data Cards Protocol provides opportunities for students to reason about associations with their own unconventional representations. The difficulty of extracting overall trends from so many variables is great, not only because of the number of variables but also because both categorical and numerical variables are included, and because of the variation that contributes to ambiguity in the message. Another challenge is to decide when and how to compress the data, with the resultant “loss” of data. The complex interplay between these factors makes it important to provide students with many opportunities to work with multivariate data and to discuss the issues associated with transnumerating and representing them.
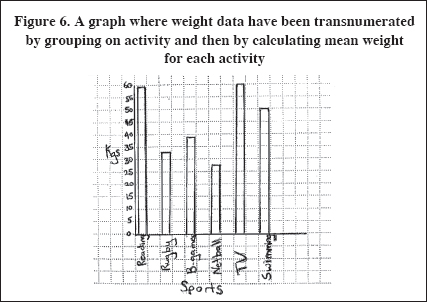
Students’ own contextual knowledge often helps them recognise possible links among variables from the Data Cards, such as “weight” and “type of activity”. When confronted with multivariate data where one variable is categorical, as is the activity type in this case, students can compare data grouped by category. The challenge is to devise a meaningful criterion for comparison, since most students’ early experiences with representing categorical data involve graphing frequency of category, which is unhelpful. The students who produced Figure 6 made an appropriate transnumerative decision to calculate averages for each of the categories of “favourite activity”. This is an important first step in informal inference, where comparison of means is central to the argument and provides evidence for a difference between groups. These particular students also realised that regarding activities as “sedentary” and “non-sedentary” might be useful, but they could not take the extra step to create a new variable associated with this. When interpreting the graph the students were surprised at their findings, as they believed the average weight for those liking swimming should be lower than for board games. This led, however, to the development of a critical insight: “The only reason why it was high was because we didn’t have enough sample … because we only had one swimmer … and he was quite old so he weighed quite a bit”. Despite this recognition of a third influencing variable—“age”—these students were unable to come up with a transnumerative strategy to investigate this.
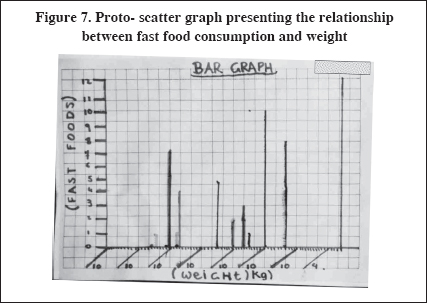
When considering two numerical variables students are sometimes quite inventive in the representations they devise, even if they do not know about scatter graphs. The students who created the graph in Figure 7 appeared to be familiar with bar graphs, but appreciated the need to draw narrow representations in order to fit in closely-spaced values on the horizontal axis. The information conveyed is that of a scatter graph showing a tendency for increases in one variable to be associated with increases in the other. Here, there has been no compression of data; rather, the challenge has been to represent the two variables in a way that illustrates the association between fast food consumption and weight.
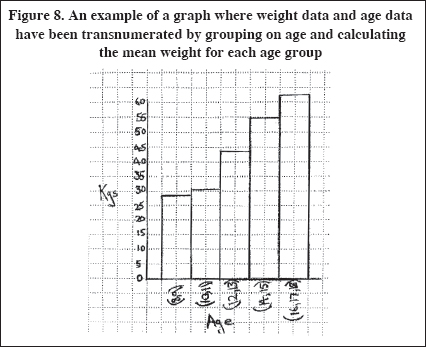
Students working on the Data Cards Protocol are also likely to start with the belief that there is an association between weight and age. This, too, could be dealt with using a scatter graph or similar, but the students whose work is shown in Figure 8 took a different approach. They transnumerated by grouping the numerical data associated with age into categories in order to deal with them. The students created five categories of age groups, thus making a new categorical variable of “age group” from the numerical variable “age.” They then calculated the mean weights for each of these age groups. By comparing means, these students corroborated the conjecture that “weight and … age have something to do with each other.” They also discovered, “There’s … a big difference between 10–11 and 12–13. That’s probably where the growth spurt is.” These students were successful at recognising, developing, and implementing criteria for an effective classification of data as well as creating new variables. Reclassifying given data is a skill that should be encouraged, as it often makes the data’s message clearer.
In contrast to this successful transnumeration, a pair of students investigating the links between age and weight made three age-group categories within each gender (e.g., Janelle, Sally, and Dorothy are the oldest girls). The students then calculated the average weight of each group, before going on to make some weight and age comparisons within each group. The transnumeration process was not completed successfully, because the students did not carry out comparisons across the whole dataset, such as comparing mean weights for different age groups and genders. These students’ work made a promising start, and had the potential to consider three variables simultaneously, but there appeared to be a struggle in dealing with the number of variables and their categorical or numerical character all at once. The students’ final representation (not illustrated here) did not convey a convincing story about the data, either by representing the data graphically or displaying several mean values for comparison.
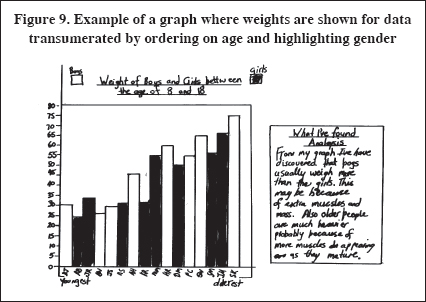
The capacity to transnumerate and represent three variables is important, but difficult. The representation of three variables in two dimensions is a challenge for the novice, but the graph in Figure 9 shows that this need not require sophisticated techniques if one of the variables is categorical. With this small dataset, failure to suppress individual cases does not necessarily prevent students reasoning from the data. Figure 9 shows how transnumeration of the variable names of students into a new variable, “gender”, and transnumeration of the variable “age” by sorting, enables the extraction of information at a sophisticated level. Here bars are used to represent weights for the ages along the horizontal axis, but colour is also used to distinguish the boys from the girls. The individual cases can still be read, but it is possible to compare weights across the males and females because the choice of representation distinguishes between them. The increase in one numerical variable with the other is plain to see, although differences in gender would appear more difficult to describe. The viewer of the representation still has to do some additional transnumeration, however, to be convinced of the claim about boys weighing more than girls; hence, communication of this message has not been totally successful.
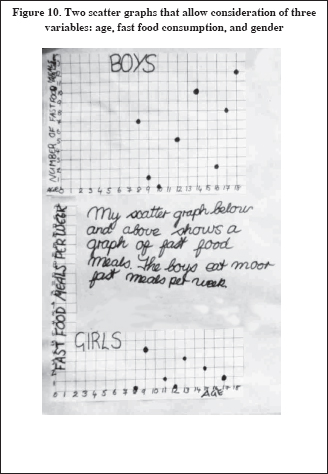
An alternative approach is offered in Figure 10, which also demonstrates a more traditional form of scatter graph for two numerical variables. The pair of scatter graphs show differences in fast-food consumption and age for boys and girls through the use of the same scale. Although not mentioned in the students’ summary, the different association of fast food consumption and age for the two genders is also shown.
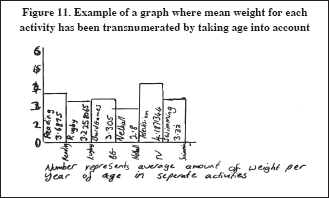
Finally, we return to the issue of taking age into account when considering weight and activity, as discussed with Figure 6. The students whose work is shown in Figure 11 incorporated this third variable with a clever piece of transnumeration. They calculated the average weight per year of age for each activity and then compared the activities through graphical means. There has been considerable compression of data in this process, but provided the reader understands the transnumeration that has taken place the representation clearly shows the relative heaviness of those whose favourite activity is television. This example, with its consideration of sample size—by considering means for the different activity categories—and the factoring out of the variable “age”—by considering weight per year—demonstrates that students can move towards fluency in handling data, in transnumeration, and in making statistical and contextual judgements, even at young ages.
Conclusion
Part of statistical understanding involves knowing how to transnumerate and represent data. Even though many students in the examples above had minimal tools to draw on, such as bar graphs and calculating means, successful representations were still possible, predicated on the ability to use these limited tools effectively to transnumerate the data. Some students, however, could not glean relevant information from the data (such as those who considered the students grouped by age and gender) or were limited in their exploration of data by focusing only on graphing a single categorical variable against frequency. A curriculum limiting student exposure to frequency graphs and univariate data constrains students’ understanding of the purpose of statistics and their knowledge of how and why data are explored. Similarly, students should have many opportunities to consider data rich in variation, so that they gain an appreciation of the ambiguity or lack of significant differences that can arise.
Transnumeration needs to be encouraged and dealt with specifically in teaching and learning. Creating successful representations depends upon nurturing the ability not only to think of multiple ways of transforming the data, but also to think of developing new variables and representing them as new entities. Students should be given opportunities to create their own representations before being introduced to conventional ones, as the effectiveness of these standard forms may be more apparent if students have grappled with their own. At the middle-school level, many of the transnumerative and representational techniques that are taught are precursors to the more powerful, statistically rigorous tools we use later. A scatter graph, for example, is the first step towards looking at lines of best fit and regression analysis; similarly, the differences noticed between two datasets, such as the girls and boys above, are later verified as being genuinely significant by using a t-test.
Multivariate data provide a natural setting for knowing why data are explored, since comparison and relationship questions can be generated, hypotheses can be supported, or new insights can be discovered. The Data Cards Protocol used here was deliberately designed to be a manageable dataset that exhibited associations and variation; the use of real datasets, containing data of interest to and collected by students, is strongly encouraged. To foster deep and rich statistical thinking, however, teachers must ensure that such data involve a range of data types and that there is the potential for the discovery of relationships. Teaching approaches in many curriculum areas should draw students’ attention to transnumeration-type thinking and develop the ability to choose and produce effective representations that convey the stories in raw data.
Acknowledgement
The authors thank Amanda Rubick for the use of her New Zealand data (Rubick, 2000).
References
Begg, A., & Pfannkuch, M. (2004). The school statistics curriculum: Statistics and probability education literature review. Report for New Zealand Ministry of Education. Wellington: Ministry of Education. Retrieved from www.cmp.ac.nz
Ben-Zvi, D., & Garfield, J. (Eds.). (2004). The challenge of developing statistical literacy, reasoning, and thinking. Dordrecht, The Netherlands: Kluwer Academic Publishers.
Chick, H., & Watson, J.M. (2001). Data representation and interpretation by primary school students working in groups. Mathematics Education Research Journal, 13, 91–111.
Curcio, F. (2001). Developing data-graph comprehension in grades K-8 (2nd ed.). Resten, VA: National Council of Teachers of Mathematics.
Konold, C., & Pollatsek, A. (2002). Data analysis as the search for signals in noisy processes. Journal for Research in Mathematics Education, 33, 259–289.
Moore, D. (1990). Uncertainty. In L. Steen (Ed.), On the shoulders of giants: New approaches to numeracy (pp. 95–137). Washington, DC: National Academy Press.
Pfannkuch, M., & Rubick, A. (2002). An exploration of students’ statistical thinking with given data. Statistics Education Research Journal, 1(2), 4–21.
Rubick, A. (2000). The statistical thinking of twelve Year 7 and 8 students. Unpublished Master’s thesis, University of Auckland.
Watson, J.M., & Callingham, R.A. (1997). Data cards: An introduction to higher order processes in data handling. Teaching Statistics, 19, 12–16.
Watson, J.M., Collis, K.F., Callingham, R.A., & Moritz, J.B. (1995). A model for assessing higher order thinking in statistics. Educational Research and Evaluation, 1(3), 247–275.
Wild, C.J., & Pfannkuch, M. (1999). Statistical thinking in empirical enquiry. International Statistical Review, 67(3), 223–248.
The authors
Helen Chick is a senior lecturer in the Department of Science and Mathematics Education at the University of Melbourne. She is interested in students’ early stochastical thinking, and teachers’ pedagogical content knowledge. Email: h.chick@unimelb.edu.au
Maxine Pfannkuch is a senior lecturer in the Departments of Statistics and Mathematics at the University of Auckland. Her research is focused on the development of students’ and teachers’ statistical thinking. Email: m.pfannkuch@auckland.ac.nz
Jane Watson is a reader in mathematics education in the Faculty of Education at the University of Tasmania, Hobart. Her main research interests are in the broad field of statistics education. Email: Jane.Watson@utas.edu.au