Beyond right or wrong
What student responses reveal about numeracy
VINCE WRIGHT AND CHARLES DARR
Meeting the NCEA numeracy co-requisite requires students to do more than perform calculations correctly. The common assessment activity administered by NZQA assesses students’ ability to apply mathematics and statistics in everyday contexts, interpret information, and justify conclusions. This article draws on the numeracy task complexity schema to analyse the demands of two 2025 common assessment activity items and examines a large sample of student responses to those items. The responses highlight both the strengths students bring to numeracy tasks and the challenges they encounter when co-ordinating calculation, interpretation, and communication. By looking beyond whether answers were simply right or wrong, the article considers what student work reveals about the nature of numeracy and discusses implications for classroom practice.
Introduction
To gain a National Certificate of Educational Achievement (NCEA), students must meet the numeracy co-requisite, usually by sitting the common assessment activity (CAA), administered by the New Zealand Qualifications Authority (NZQA) twice each year. Supporting students to succeed requires more than practising sample questions; it calls for a clear understanding of what numeracy involves and the kinds of thinking the assessment demands.
This article explores what numeracy means in the context of the CAA and examines the demands the assessment items place on learners. An international framework for analysing those demands is applied to two CAA items. Drawing on student responses, the discussion highlights what these items reveal about students’ thinking and considers the implications for teaching and learning.
What is numeracy?
The numeracy CAA is designed to assess NCEA unit standard 32406: Apply mathematics and statistics in a range of everyday situations. This 10-credit standard defines numeracy as “the ability to access, use, interpret, and communicate mathematical and statistical information and ideas”. Within this standard, students are expected to:
1.formulate mathematical and statistical approaches to solving problems in a range of everyday situations
2.apply mathematical and statistical procedures correctly in those situations
3.explain their mathematical and statistical responses.
This definition aligns closely with international perspectives. For example, the Programme for International Student Assessment (PISA) defines mathematical literacy as:
An individual’s capacity to formulate, employ, and interpret mathematics in a variety of contexts, including reasoning mathematically and using concepts, procedures, facts, and tools to describe, explain, and predict phenomena. (OECD, 2013, p. 25)
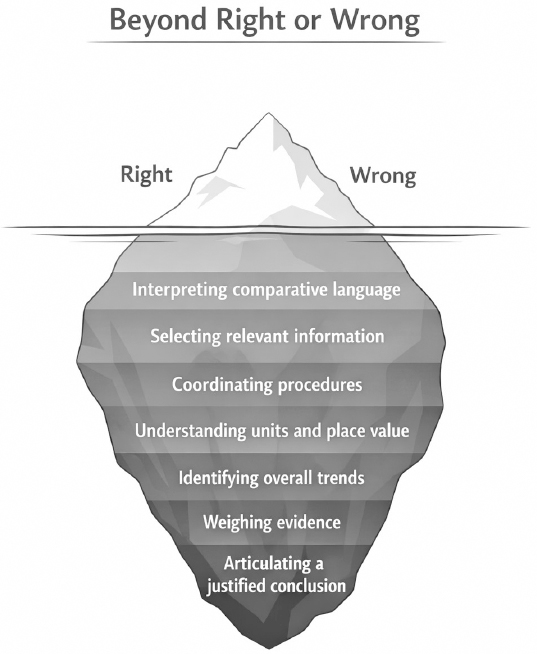
Figure 1. Beyond right or wrong
Similarly, the Programme for the International Assessment of Adult Competencies (PIAAC) defines numeracy as:
the ability to access, use, interpret and communicate mathematical information and ideas, in order to engage in and manage the mathematical demands of a range of situations in adult life. (OECD, 2012, p. 33)
What is the numeracy CAA?
The numeracy CAA is a national, externally set assessment used to determine whether students meet the NCEA numeracy co-requisite (unit standard 32406).
It is completed digitally in schools during national assessment windows and is designed to take about 60 minutes in a single session.
The assessment presents a series of short tasks based on everyday contexts. Students must interpret information, select and apply appropriate mathematical or statistical methods, and explain their reasoning.
Responses are marked by NZQA using a combination of automated and human marking. Each item is scored using a marking schedule as either correct (1) or incorrect (0), and the total score is used to determine performance.
Students meet the standard by reaching a cut score that indicates they have demonstrated sufficient evidence across the outcomes of the standard.
Both definitions emphasise that numeracy is about applying mathematics in real-world contexts. Numeracy requires more than knowledge of procedures; students must interpret situations, plan an approach, make judgements, and sometimes consider broader social or ethical dimensions.
Numeracy and mathematics are closely related, but they are not the same. Numeracy focuses on the purposeful use of mathematics. A learner may know a mathematical procedure, but numeracy requires deciding whether that procedure is useful and whether the resulting answer makes sense for the situation.
Defining numeracy in this way shapes the nature of the assessment items used to measure it. Items in the numeracy CAA are designed to reflect everyday situations and to require students to formulate, apply, and explain mathematical and statistical responses. These kinds of demands can even challenge students who are comfortable with mathematical procedures in familiar classroom settings.
The demands of numeracy assessment items
A helpful way to understand the demands of a numeracy item is provided by the numeracy task complexity schema (NTCS), which was originally developed to analyse the complexity of PIAAC assessment items (Tout et al., 2020). The schema identifies five interacting factors that together shape the difficulty of numeracy items. Two of these factors relate mainly to textual features of the task, and three relate more directly to the mathematical demands.1
The five factors are summarised in Table 1.
The NTCS has proven to be a robust framework for estimating the difficulty of a numeracy assessment item (Tout et al., 2020). It provides a practical way to analyse the demands of an item and predict where students may face challenges.
In the sections that follow, we draw on student responses to two items from numeracy CAAs administered in 2025. We reviewed a large sample of responses to identify recurring patterns in students’ reasoning, errors, and interpretations. The examples discussed illustrate themes evident across many responses, rather than isolated cases. Using the NTCS, we examine the demands of the items and then consider how students responded to those demands, highlighting implications for teaching and learning.
Item 1: Olympic Medallist Times
Introducing the item
The first CAA item we look at is called Olympic Medallist Times (see Figure 2). The item is the fifth in a suite of six tasks that involve the context of swimming. In the item, students are presented with a real-world sporting context: a 100-metre final at the Olympic Games. An image of the race is accompanied by a table showing the finishing times for the gold, silver, and bronze medallists.
Students are asked to evaluate a statement about the difference in times between the swimmers who won gold and bronze.
The complexity of the task
Using the NTCS, we can describe the demands of this item across the five complexity factors.
1. Problem transparency
The relevant data are clearly presented in the table, and students are asked directly to use a calculation with decimals to explain whether the statement is correct. However, the question does not explicitly tell students what operation to use. They must decide for themselves that evaluating the statement requires finding the difference between the gold and bronze times.
Table 1. A summary of the numeracy task complexity schema
| Factor |
What this means in practice |
When demand is lower … |
When demand is higher … |
|
1.Type of match/Problem transparency |
Is it easy for students to work out what they need to do and where to find the relevant information? |
The task clearly states what to calculate or decide. The relevant numbers or data are obvious. Little reading or interpretation is required. |
Students must interpret language, search through text or visuals, decide what action is needed, or bring in outside knowledge (e.g., knowing a formula). The required action is not explicitly stated. |
|
2.Plausibility of distractors |
Is irrelevant or potentially misleading information present? |
Only the needed information is provided.
No extra numbers or data compete for attention. |
Extra numbers, labels, or data are included. Some look relevant but are not. Students must select carefully. |
|
3. Complexity of mathematical information/data |
How familiar, abstract, or symbolically demanding is the mathematics? |
Familiar contexts. Whole numbers or simple decimals. Clear tables or simple graphs. Everyday units. |
Large numbers, fractions, percentages, rates, algebraic expressions, dense tables, or complex graphs. Unfamiliar representations or symbolic notation. |
|
4.Type of operation/skill required |
What kind of mathematical thinking is needed? |
A single straightforward calculation or direct reading from a graph/table. |
Multi-step reasoning. Interpreting trends. Using formulas. Comparing quantities. Explaining reasoning. Making judgements about reasonableness. |
|
5.E xpected number of operations/processes |
How many co-ordinated steps are required to complete the task? |
One clear step (e.g., calculate a difference, read a value). |
Several linked steps (e.g., select data, calculate, compare, justify). May involve different types of processes (calculation + interpretation + explanation). |
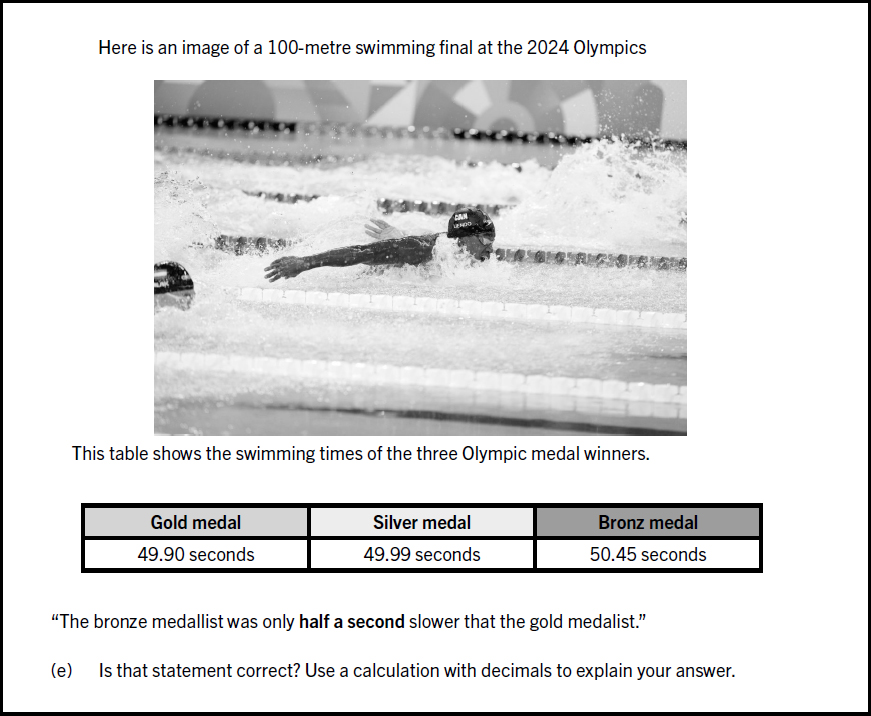
Figure 2. The Olympic Medallist Times item
2. Distracting information
Including the silver medallist’s time in the table introduces a mild distractor, requiring students to select the correct pair of values. While the information about the length of the race and the year of the Olympic Games are relevant to the context, this information is not relevant to answering the problem.
3. Complexity of mathematical information/data
The data involve measurements of time expressed in seconds to two decimal places. Although these are familiar quantities, interpreting and operating accurately with decimal time increases the demand.
4. Type of operation/skill
The core calculation involves calculating the difference between two decimals. Differences can be calculated by subtraction, or by addition, Students also need to connect the result, 0.55 seconds, to “half a second”, possibly using 0.5 seconds.
The requirement to evaluate the statement, however, adds a layer of interpretive and reasoning demand: students must connect their numerical result back to the statement and decide whether it supports or contradicts it.
In addition, students must communicate their reasoning, linking their calculation to the original statement.
5. Expected number of operations/processes
The task requires selecting the correct data, identifying one main calculation, making a judgement about the result and then articulating their response. Although this is a relatively short solution path, it involves more than a single mechanical step.
How did students respond?
Olympic Medallist Times proved to be one of the most difficult items in the 2025 numeracy CAA. Only 30% of the 30,277 students who attempted the CAA digitally in Week 1 answered the item correctly. Success on a parallel item in the second week of administration was similar at 26%. In the discussion below, we look at the characteristics of correct responses before examining some common difficulties.
Characteristics of correct responses
According to the assessment schedule, students were allowed to take an accept or reject position, provided there was evidence of correct calculation and interpretation of the result. Overall, there was considerable variation in the way students explained their acceptance or refutation of the statement.
In the example of a correct answer shown below,2 the student has concluded that the statement is correct. They have recognised that 0.5 seconds equals half a second and added 0.5 to the gold medallist’s time to test the correctness of the statement:
49.90 + 0.5 = 50.4 and the bronze medallist got 50.45, so I would say the statement is correct—he is only half a second slower than the gold medallist.
Below, both students have refuted the statement using subtraction to find the difference in times:
No, because you do 50.45 - 49.90 = 0.55 second difference. The bronze medallist statements [says] he’s only half a second slower than gold. However, there was a 0.55 second difference. So, he is wrong because it isn’t exactly half a second slower [than] the gold medallist.
If this statement were an estimate, it would be correct, but the bronze medallist was 0.55 seconds off the gold medallist, meaning this statement is wrong. 50.45 take away 49.90 equals 0.55, which is the difference between the two times.
Challenges related to the problem
Many students struggled to generate an appropriate response. Analysis of these responses highlighted several issues.
1. Misunderstanding “half a second”
A notable proportion of students struggled to convert “half a second” to a decimal number. For instance, one student wrote:
49.90 + 0.30 = 50.20 seconds. The bronze medallist’s time was 50.45 seconds, .15 seconds over half a minute. So, the statement is not true.
This response suggests that the student interpreted half a second as 0.30 rather than 0.50.
Implication: Students may need support to connect decimal notation with fractional meaning, particularly in time contexts where base-10 decimals and base-60 conventions can conflict. Making explicit that 0.5 represents one-half of a unit (in this case a second) may help reduce this confusion.
2. Decimal subtraction error
Some students struggled to apply place value understanding or co-ordinate a procedure to work out the difference between the two decimals. For example, another response read:
50.45 − 49.90 = 0.46 so, yes because he wasn’t one half second off, he was only 0.46 secs off.
Here, the student selected a correct operation but made an error in subtracting the decimals. The response suggests difficulty aligning place values or regrouping across decimal places, combined with limited checking of whether the result was reasonable.
Implication: Students need a secure understanding of decimal place value and experience with co-ordinating procedures and sense checking. Encouraging students to anticipate whether the difference should be less than or greater than 0.5 seconds, and to check whether their answer fits that expectation, may help reduce this type of error.
3. Confusion about units and place value
Another student wrote:
I think this statement is false. The bronze medal has a time of 50.45 seconds and the gold medal is 49.90 seconds. 50.45 − 49.90 = 0.55 so that is 5 more than half a second. A second is 100 milliseconds and the time was 0.55 so 5 milliseconds over. So that’s why I disagree.
In this case, the subtraction is correct, and the judgement aligns with the calculation. However, the student refers to hundredths of a second as milliseconds, indicating uncertainty about how decimal place value relates to units of measurement.
Implication: Even when students arrive at the correct numerical answer, misunderstandings about units may remain. Making explicit connections between decimal place value and metric prefixes (e.g., linking hundredths to centi- and thousandths to milli-) can help students see how decimal structure and measurement units align.
4. Misinterpreting the statement
A different student wrote:
½ × 50.45 = 25.23 and ½ × 49.40 = 24.95.
This response indicates that the student interpreted the phrase “half a second slower” as an instruction to halve the medallists’ times rather than to work out the difference between them. The difficulty here appears to lie in interpreting the statement rather than in performing arithmetic.
Implication: Students need opportunities to practise translating comparative language into mathematical relationships and identifying the quantities being compared before selecting an operation.
5. Partial reasoning and co-ordination errors
It was also common for students to be partially correct and partially incorrect—for example, correctly carrying out a calculation but comparing the wrong medallists, or taking a defensible position but providing insufficient evidence of correct working.
One student wrote:
50.45 − 49.99 = 0.46 seconds. The statement is incorrect, because half a second is equal to 0.5 seconds, but the bronze medallist was 0.46 seconds slower, which is less than half a second.
In this response, the student appears to have calculated the difference between the gold and silver medallists rather than the gold and bronze medallists. The comparison to 0.5 seconds is mathematically correct, and the reasoning about “less than half a second” is coherent. However, the conclusion is based on the wrong pair of values.
Implication: Numeracy tasks often require students to co-ordinate several elements at once; for instance, selecting the correct data, performing an accurate calculation, and linking the result to a statement. Encouraging students to slow down and check they have the relevant quantities before calculating may help reduce this type of co-ordination error.
Item 2: E-Scooter Insurance Claims
Introducing the item
The second item we examine from the CAA is E-Scooter Insurance Claims (see Figure 3). This is the last question in a suite of six tasks involving the context of e-scooters. In the item, students are presented with a graph showing the number of insurance claims for e-scooter riders from 2018 to 2024.
Students are asked to evaluate a statement about how the number of claims had changed over time and to use information from the graph to justify their answer.
The complexity of the task
1. Problem transparency
The graph is clearly presented and visually accessible. Claim numbers are printed within the data points, and grid lines are provided to simplify reading information from the graph. Students are also told directly to decide whether a statement is correct and explain their answer.
However, students must decide which information in the graph is relevant and how it can be used to support an overall judgement. In addition, the context presents linguistic challenges. The term “fewer” must be interpreted as indicating a decrease over time, and comprehension of “insurance claims” requires understanding that a “claim” refers to an application for compensation following an accident.
2. Distracting information
Spikes and troughs in the data are the main potential distractors, as they can encourage students to focus on short-term variation rather than identifying the overall trend across the full range of years.
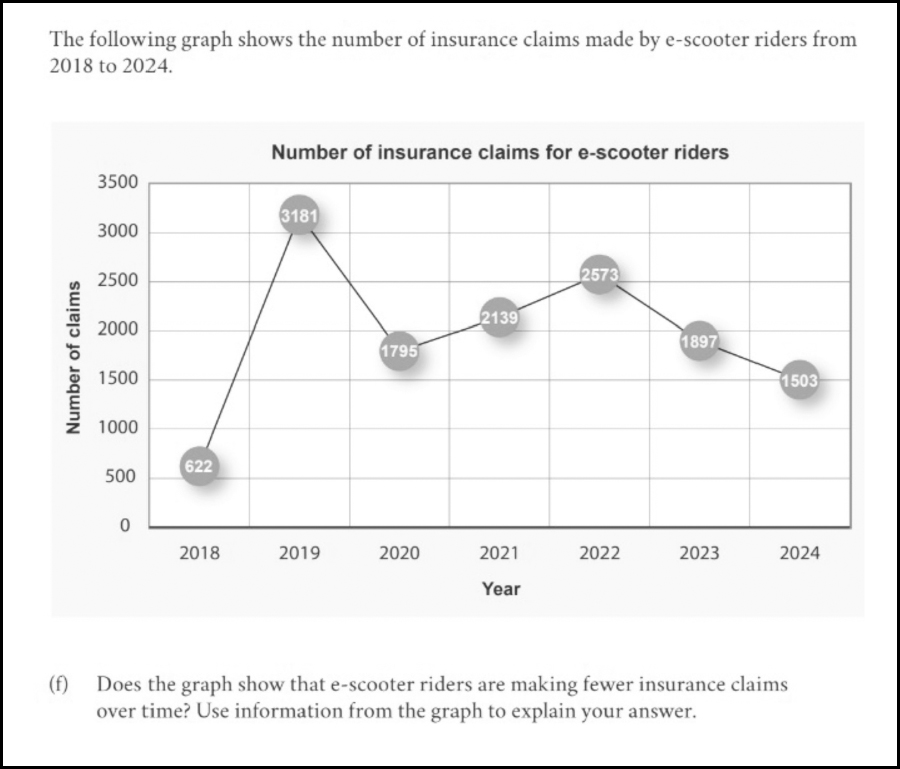
Figure 3. The e-scooter insurance item
3. Complexity of mathematical information/data
Neither the graph nor the numbers involved are particularly demanding. The fluctuating pattern across the dataset increases interpretive demand.
4. Type of operation/skill
The task involves minimal calculation, although simple comparisons between values may be used to support a conclusion.
The key demand lies in synthesising information across multiple data points to determine whether the overall pattern supports the statement that e-scooter riders are “making fewer claims over time”. As noted, the data fluctuate across the period shown, with both rises and falls. Students must therefore decide whether to focus on comparing the first and last years, short-term changes from year to year, or the broader trend.
The task also includes a communication demand. Students must state a clear position and justify it using evidence from the graph.
5. Expected number of operations/processes
Although no complex calculation is required, the pathway to an answer involves multiple connected statistical processes.
What can we learn from student responses?
E-Scooter Insurance Claims proved to be of moderate difficulty in the 2025 numeracy CAA. Around 49% of the 30,277 students who attempted the CAA digitally in the first week of administration answered the item correctly. Performance in the second week on a parallel item was similar with 50% correct.
Characteristics of correct responses
According to the assessment schedule, students were allowed to take an accept, reject, or unclear position regarding the statement, provided there was evidence in support of that position. This could be done in many ways.
For example, in the following response, the student has concluded that the statement is correct. They have argued that the data for the period 2019–2024 represents a decline in claims, acknowledging the spikes in the data for 2019 and 2022:
According to the graph, 622 claims were made in 2018 and then it skyrocketed up to 3,181 in 2019. It spiked again in 2022 with 2,573, but started going down again with a final of 1,503 claims in 2024. While the graph does show fewer insurance claims from 2019–2024, it does show some spikes. The overall trend is going down, so yes.
In the next two examples, the students have refuted the statement arguing that the variation over time made an overall trend unclear. One has also argued that more data would be needed to have greater confidence in the trend:
Not really, due to it constantly increasing then deceasing making it hard to tell. Back in 2018 there were only 622 insurance claims in that year but in 2019 in peaked to 3,181. However, the next year it decreases to 1795 but increases yet again to 2,139. Since 2022, which had 2,573 insurance claims, it has been steadily decreasing but we can’t really say for a few more years due to the up and down nature of the graphs.
* * * * *
I can’t say for sure whether the claims are getting higher or lower. As 2019 was high sitting at 3,181. After that year it has dropped but had many ups and downs, so I can’t say for sure.
In general, the features associated with a correct response included: stating a position; establishing the overall trend over time; noting spikes and troughs where appropriate; and referring to relevant timepoints to support the argument.
Challenges related to the problem
There were several notable features associated with incorrect responses.
1. Addressing the statement
Some students did not indicate whether they accepted, rejected, or were uncertain about the statement. Their answers sometimes showed recognition of trends and correct reading of value pairs from the graph.
For example, one student wrote:
It shows that in 2018 [they] have about 622 claims and in 2024 it goes higher by 1,503.
Another student proposed an “average” trend line, consistent with a rolling average. That approach addressed the trend requirement; however, the student’s accept position about the statement was not clearly stated:
As time goes on, there are ever so slightly less insurance claims, but that could just mean the number isn’t really changing. Drawing a line that tries its best to go through all of the dots evenly, seems to produce a slightly negative slope.
Absence of a comment related to the correctness of the statement was often the only missing feature in otherwise competent answers.
Implication: Students may need support with taking and then stating a position related to a given statement. Teaching students to identify evaluative language (e.g., “Does the graph show …?”) and to structure their responses so that evidence is clearly linked to a stated conclusion may help strengthen how well they do on this type of task.
2. Noticing and correctly describing trend
Some students struggled to capture the sense of an overall trend (or lack of trend). No comment on the overall trend was often associated with no overall position regarding the correctness of the statement. Sometimes, these students provided a string of value pairs without noting a trend:
I’m … because of the time in 2018 it was 622 and 2020 is 1,795 and 2021 is 2,139 and in 2022 is 2,573 and 2023 is 1,897 and in 2024 it is 1,503.
In the following response, the student described directional movement between years without establishing an overall trend and taking a position on the statement:
As you can see the peak insurance claims are near 2019 but as we go in 2020 it starts to drop but then goes up a little near 2021 to 2022 and then begins to drop again near 2023.
Some comments regarding the trend were incorrect. The response below showed the student noticed the spike in 2019 but confused variation with steady growth in claim numbers:
According to the graph, e-scooter riders peaked in 2019 by making 3,181 insurance claims, but from then onwards (2019–2024) it is staying at a steady rate. So, my answer is no, e-scooter riders are not making fewer insurance claims over time.
Implication: Students may need support to establish what constitutes a trend in time-series data and that it can be valid to say any trend is unclear, especially in the face of variation that naturally occurs in the real world. Students who were successful in describing a trend were able to navigate the year-to-year spikes and troughs to consider the whole range. Students who focused on directional change between pairs of years, rather than across a range in years, found it difficult to find an overall trend.
3. Personal interpretation of the context
In statistical inquiry, knowledge of the context supports students to reason from, about, and beyond the data (Makar & Rubin, 2009). Ironically, contextual knowledge sometimes led students to voice opinions related to a claim without considering the data presented to them.
A student wrote:
[In] 2019 lots of people use it for work. Some people still use it till this day so from 2019–2022 is when people started to change or some bought cars.
A reader might infer that the observation that people bought cars means the student explained why a negative trend in claim numbers occurred. However, their attempt to reason about the data resulted in them not answering the stated question.
Similarly, another student explained decline in numbers without clarifying whether they were referring to number of claims or riders:
As time passes e-scooters go down in years not up as is not safe to ride.
Another student associated decline in claims with decline in rider numbers:
Because over the years people I guess have stopped using them more and more, meaning that there would be less insurance claims.
Implication: Students may need support to decide when it is appropriate to use personal contextual knowledge and when it is not. Contextual knowledge is crucial to reasoning about the data that involves explaining why data is the way it is. However, evaluating the claims of others involves reasoning from the given data. That requires suspension of personal beliefs and examination of whether those data support the statement being made.
4. Vocabulary
Some students appeared to have difficulty with interpretation of the word “fewer” as a comparative term, confusing it with an increasing trend.
The responses from two students below exemplify that confusion:
2018, e-scooters had 622 insurance claims. In 2019 it had went up by 3,181 insurance claims. So Yes e-scooters are making fewer insurance claims over time as it still goes up little by little until 2024.
* * * * *
I agree, because [in] 2018 they went from 500 to 3,000.
Confusions related to the context were rare. In the responses below, students interpret the numbers in the graphs as number of rides and number of scooters:
E scooter rides peaked in 2019 and slowly started decreasing in 2023.
* * * * *
From 2018 to 2019 we see a big jump, that is because this is when e-scooters first became popular. We then see a dip after the first year and the excitement died down and in the last two years it has drop even more.
Implication: Students need to be explicitly taught the kind of vocabulary used in mathematical contexts, particularly the mathematical meaning of words that is sometimes different from common meaning.
5. No answer
The absence of an answer might indicate that the student does not know how to answer the question, believes they have insufficient digital writing skills to create an answer, or does not want to engage. Given that the item occurred late in a 30-item test, test fatigue was a plausible reason for non-attempts. Four percent of students provided no response but only 15 students used a variant of “?” to indicate not knowing how to answer. Few students recorded their lack of motivation as indicated below:
… also don’t wanna do all this … can’t be bothered.
Implication: Students need experience with completing test items, particularly those requiring a written response in a digital environment. The literacy demands of numeracy items mean that many students need explicit support with interpreting questions, planning and executing the required mathematical procedures, and representing the results in text. Teachers of numeracy are also teachers of literacy (Gomez et al, 2021).
Final thoughts
Using the NTCS framework to examine item demands alongside student responses highlights that numeracy extends beyond performing calculations or reading data. The framework draws attention to the factors at play in a task, while student responses open a window into how learners interpret, co-ordinate, and communicate their thinking.
In the first item examined, difficulties often arose not from selecting an operation, but from co-ordinating place value understanding, applying decimals in the context of time, and articulating a clear justification. In the second item, students frequently demonstrated partial statistical reasoning but struggled to establish and express an overall view about change over time.
In both cases, success depended on integrating multiple processes: selecting relevant information; applying mathematical or statistical reasoning; and communicating a justified conclusion. Students who could perform individual components in isolation were not always successful when those components needed to be co-ordinated.
These patterns suggest that supporting numeracy development requires attention, not only to procedural fluency, but also to interpretation, the careful use of evidence, argument construction, and clear communication. Frameworks such as the NTCS can be useful for teachers, not as a recipe for assessment preparation, but as a way to notice the kinds of demands that are at play in numeracy tasks. Deliberately designing opportunities for students to interpret information, navigate irrelevant detail, work with unfamiliar representations, and justify their reasoning may help build the co-ordinated capabilities that numeracy requires.
Numeracy tasks are, in effect, small acts of structured reasoning. Teachers of numeracy are also teachers of context, literacy, and critical thinking.
Notes
1It is important to note that performance on a numeracy item can also be influenced by factors that are not necessarily covered by the schema, such as a student’s familiarity with the context, general reading demands, or confidence in test situations. In a school setting, additional influences may include students’ prior classroom experiences, their expectations of what “counts” as mathematics, or their willingness to persist with unfamiliar problem types.
2Student responses have been lightly edited for spelling, punctuation, and clarity. The original meaning has been retained.
References
Gomez, A., Pecina, E., Villanueva, S. & Huber, T. (2021). The undeniable relationship between reading comprehension and mathematics performance. Educational Research. 30. 1329–1654.
Makar, K., & Rubin, A. (2009). A framework for thinking about informal statistical inference. Statistics Education Research Journal, 8(1), 82–105. https://doi.org/10.52041/serj.v8i1.457
OECD. (2012). Literacy, numeracy and problem solving in technology-rich environments: Framework for the OECD survey of adult skills. OECD Publishing. https://doi.org/10.1787/9789264128859-en
OECD. (2013). PISA 2012 Assessment and analytical framework: Mathematics, reading, science, problem solving and financial literacy. PISA, OECD Publishing. https://doi.org/10.1787/9789264190511-en.
Tout, D., Gal, I., van Groenestijn, M., Manly, M., & Schmitt, M. J. (2020). PIAAC numeracy task complexity schema: Factors that impact on item difficulty. Australian Council for Educational Research. https://doi.org/10.37517/978-1-74286-609-3.
 Dr Vince Wright is a mathematics education consultant with extensive experience in curriculum design and professional learning.
Dr Charles Darr is a chief researcher at NZCER.