A four-stage framework for assessing statistical literacy
Sashi Sharma, Phil Doyle, Viney Shandil and Semisi Talakia' atu
Abstract
Despite statistical literacy being relatively new in statistics education research, it needs special attention as attempts are being made to enhance the teaching, learning and assessing of this strand. It is important that teachers are aware of the challenges of teaching and assessing of literacy. The growing importance of statistics in today’s information world and conceptions of statistical literacy are outlined and models for developing statistical literacy from research literature are considered. A four-stage framework for assessing statistical literacy from our design research is proposed. Responses to tasks used in our research are provided to explain the levels of thinking and the article concludes with some implications for practice and research.
Introduction
Is there a link between drinking cola and children’s health?
(http://www.figurethis.org/challenges/c68/challenge.htm
Should cell phones be banned in schools?
Asthma common among well-known New Zealanders
(New Zealand Herald, 16 December 2009)
Advances in technology and communication have increased the amount of information delivered through everyday media, and presented as tables and graphs. People across the world are exposed to statistical information in their everyday life and workplace. Questions and disputable statements of public policy and personal choices, such as those above, regularly appear in the news. However, people without statistical literacy may be misled or have difficulty in interpreting and critically evaluating such information (Budgett & Pfannkuch, 2010). They may need to check how the term “well-known” is defined, judge whether drinking cola is linked to health, verify claims such as “cell phones should be banned in schools”. In short, they need to statistically and critically evaluate such information and, where appropriate, communicate their opinions to others (Gal, 2004). According to Best (2001), consumers need to understand that statistics is a social construct and that people debating social problems may choose statistics selectively and present them to support their point of view. For example, gun-control advocates may be more likely to report the number of children killed by guns, whereas opponents of gun control may prefer to count citizens who use guns to defend themselves from attack. However, people often choose to rely on an author’s interpretation and seem not to engage adequately with such information.
The importance of statistics in everyday life and work has led to calls for an increased attention to statistics and statistical literacy in the mathematics curriculum (Ministry of Education, 2007; Schield, 2010; Shaughnessy, 2007; Watson, 2006). Schield (2010) argues that one of the most important goals of the teaching of statistics in schools is to prepare students to deal with the statistical information that increasingly impacts on their lives and environments. More specifically, a critical stance (Gal, 2004)—that is, the ability to take and evaluative stance with respect to statistical flaws and biases contained in media, marketing and financial reports—is of vital importance in the quest for statistical literacy. Moreover, Gal claims that anyone who lacks these skills is functionally illiterate as a productive worker, an informed consumer or a responsible citizen. Watson (2000) adds that the cross-curricular need for statistical literacy skills is recognised in many curriculum documents around the world. She exhorts teachers across subjects to co-operate and structure experiences that support student ability to question claims made without justification in the wider social contexts.
In New Zealand, Begg et al. (2004) have called for a greater emphasis to be placed on statistical literacy in the curriculum so that students can become active and critical citizens. The use of the term statistical literacy is much more explicit in the new curriculum document with the addition of statistical literacy achievement objectives (Ministry of Education, 2007). Additionally, schools are being asked to prepare students to be flexible thinkers, lifelong learners and to manage the complexities of an uncertain world (Organisation for Economic Cooperation and Development (OECD), 2005; Steen, 1997). Critical thinking and critical literacies are embedded across the statements for key competencies, values and descriptions of learning areas in the new curriculum (Ministry of Education, 2007). It follows that students should be able to evaluate critically claims like those at the beginning of this section, ask “worry questions” and make judgements about the validity of the claims made rather than just accepting the information.
It is essential, therefore, to place emphasis on issues that adults may have to cope with as consumers of statistics and on the implications for needed knowledge and educational experience. Like Gal (2004) the authors believe that attention to real-world demands should be part of the considerations that guide what gets taught, assessed and valued in the statistics classroom. The emphasis on critical thinking and contextual understanding, however, can present challenges for teaching and assessment (Garfield & Ben-Zvi, 2008; Shaughnessy, 2007; Watson, 2006). To assist teachers, a framework needs to be identified that will provide information about the cognitive skills, including critical thinking in socially-based curriculum approaches. We believe such a framework is likely to be dynamic in nature and can be viewed as a developmental sequence. This means that prior knowledge and experiences will influence current understanding and lead to the development of more complex statistical literacy constructs.
The aim of this paper is to furnish teachers with a tool that can be used to scaffold and assess students’ statistical literacy constructs. Specifically, it presents and describes a new four-stage framework that could be used in the classroom. The paper is organised into three sections. First, we define statistical literacy and review two models of statistical literacy frameworks. Secondly, we briefly explain how our framework was developed. Thirdly, we present and discuss our framework, and in the final section, we consider some suggestions for teaching and learning and research.
Statistical literacy frameworks
Although the importance of statistical literacy is recognised by many teachers, education researchers and curriculum documents both here in New Zealand and internationally, conceptions of statistical literacy vary (Gal, 2004; Garfield, delMas & Zieffler, 2010; Shaughnessy, 2007). According to Garfield et al. (2010), statistical literacy involves understanding and using the basic language and tools of statistics: knowing what basic statistical terms mean; understanding the use of simple statistical symbols; and recognising and being able to interpret different representations of data. The authors use terms such as describe, interpret and read to assess outcomes for statistical literacy.
Wallman (1993, p. 1) describes statistical literacy as, “the ability to understand and critically evaluate statistical results that permeate our daily lives—coupled with the ability to appreciate the contributions that statistical thinking can make in public and private, professional and personal decisions”. We see in Wallman’s definition both a personal and a societal need for our students to develop statistical literacy skills. Watson (2006) reminds us that such a definition requires that students must develop not only the mathematical, literacy and statistical skills required to understand statistical information, but also an appreciation of the social context in which the data are set.
Gal (2004) defines statistical literacy as a basic principle for participation in society and the “key ability expected of citizens in information-laden societies” (p. 47) where decision making is based on critical skills from statistical literacy. Gal claims that statistically literate people can critically evaluate and, where appropriate, express their opinions regarding statistical information or data-related arguments verbally and in writing. Gal further argues that statistically literate behaviour requires the joint activation of both cognitive and dispositional components.
Clearly, the type of statistical literacy that Gal (2004) and Wallman (1993) identify is different from just being able to read and evaluate data and graphs. From the definition provided by Gal, a number of aspects entwine to create a complex statistical literacy construct. We need a framework that identifies the different elements involved in the conceptualisation of statistical literacy (cognitive skills, critical thinking and dispositions). The discussion below considers two frameworks or models that attempt to represent the features of statistical literacy discussed above. The first framework is from Gal’s (2004) research into the understanding of statistics by adults. The second model is the Statistical Literacy Construct from Watson and Callingham (2003).
Gal’s model of statistical literacy
Gal (2004) proposes a statistical literacy model that involves both a knowledge element and certain attitude or dispositional components described in Figure 1.
Figure 1: Components of statistical literacy (Gal, 2004)
| Knowledge elements | Dispositional elements |
Mathematical knowledge Statistical knowledge Knowledge of the context Literacy skills Critical questions | Beliefs and attitudes Critical stance |
Figure 1 indicates that there are five interrelated cognitive elements that must be used to exhibit knowledge component of statistical literacy. According to Gal, some of these elements are held in common with literacy and numeracy whereas others are unique to statistical literacy. Furthermore, Gal adds that a model of statistical literacy also focuses on the dispositional aspects of statistical literacy. For Gal, the dispositions or associated attitudes and beliefs motivate citizens to be critical thinkers with statistics. In addition, when an adequate level of statistical literacy has been reached, it allows the individual to take the knowledge bases and critical thinking skills that have been accumulated and apply them on their own to the statistical information they encounter in everyday life and workplace. According to Gal, the components and elements in the model should not be viewed as fixed and separate entities but as a context-dependent, dynamic set of knowledge and dispositions that together produce statistically literate behaviour. This means that a focus on only one or two elements will not be sufficient to develop statistical literacy.
Statistical Literacy Construct
The Statistical Literacy Construct from Watson and Callingham (2003) builds on previous work by Watson (1997) where she uses the SOLO taxonomy of Biggs and Collis (1982) from developmental psychology to categorise statistical literacy into a three-tier hierarchy. Watson and Callingham (2003) have developed the three-tiered view into their Statistical Literacy Construct (see Figure 2).
Figure 2: A Statistical Literacy Construct (Watson & Callingham, 2003, p. 14)
6.Critical Mathematical
Critical, questioning engagement with context, using proportional reasoning particularly in media or chance contexts, showing appreciation of the need for uncertainty in making predictions, and interpreting subtle aspects of language.
5.Critical
Critical, questioning engagement in familiar and unfamiliar contexts that do not involve proportional reasoning, but which do involve appropriate use of terminology, qualitative interpretation of chance, and appreciation of variation.
4Consistent Noncritical
Appropriate but noncritical engagement with context, multiple aspects of terminology usage, appreciation of variation in chance settings only, and statistical skills associated with the mean, simple probabilities, and graph characteristics.
3Inconsistent
Selective engagement with context, often in supportive formats, appropriate recognition of conclusions but without justification, and qualitative rather than quantitative use of statistical ideas.
2.Informal
Only colloquial or informal engagement with context often reflecting intuitive nonstatistical beliefs, single elements of complex terminology and settings, and basic one-step straightforward table, graph, and chance calculations.
1.Idiosyncratic
Idiosyncratic engagement with context, tautological use of terminology, and basic mathematical skills associated with one-to-one counting and reading cell values in tables.
The model is a six-level hierarchy that represents increasingly sophisticated thinking, from idiosyncratic through to critical mathematical. At the Idiosyncratic (Level 1) and Informal (Level 2) levels students are only merely interacting with the language and meanings of statistical terms. For the Inconsistent (Level 3) and Consistent Noncritical (Level 4) levels of the construct, students are beginning to engage with the context and uncover the statistics embedded in the context. In the last two levels of the progression—Critical (Level 5) and Critical Mathematical (Level 6)—students are able to be critical and challenge claims made in statistical reports and data. Watson and Callingham believe that traditional textbook questions could fulfil the requirements of Levels 1 and 2, but that the same types of questions were unlikely to fulfil the need of “providing motivating contexts to challenge students’ critical thinking” (Watson and Callingham, 2005, p. 135) and that teachers would have to seek out contexts such as media reports to motivate and engage students.
A real strength of the Watson and Callingham (2003) model is that the researchers have validated their statistical literacy framework with responses from a large number of Australian students at different age groups. This has enabled them to attempt to determine how and when instruction for statistical literacy could take place. There are some obvious differences between Gal’s (2004) approach and that taken by Watson and Callingham (2003). Gal presents a complete definition of statistical literacy along with the necessary components that are needed. However, Watson and Callingham differentiate between hierarchical levels of statistical literacy. Secondly, dispositions play a key role in Gal’s model whereas dispositions are not given explicit focus by Watson and Callingham. The different approaches can be explained by the contexts of their studies into adults and students respectively. The essence of both Gal’s and Watson and Callingham’s descriptions are very similar. Both emphasise a need for statistical knowledge and skills, the ability to communicate ideas, the centrality of context and the need to be critical. Watson and Callingham’s (2003) Statistical Literacy Construct has been identified from data that were gathered under test conditions, and the issue of providing assessment as part of normal classroom setting remains. Like Ainley and Pratt (2010) we believe that both models have certain uses in the field of assessment because they help us answer the question of what is to be assessed. They can be useful at a macro level of development to help policy makers to take decisions about the big ideas that should be taught at different curriculum levels. However, we must also identify who is the assessor and what is the purpose of assessment (Ainley & Pratt, 2010). Since we were interested in how teachers could identify their students’ current understanding and scaffold their learning at a particular point in time, we needed a specific framework that could be used to inform teaching at the classroom level.
Method
Data reported here are part of a larger collaborative research project (Sharma, Doyle, Shandil, & Talakia'atu, 2011) designed to develop statistical literacy with Year 9 students. Students’ thinking and understanding were given a central place in the design and implementation phases of our project.
The project lasted for two years and included repeated reflection and cycles. Design details are discussed in Sharma et al. (2011). In preparing for the design experiment, we conducted whole-class performance assessments with two groups of Year 9 students from the same school in which we planned to work. The purpose of the assessment was to obtain data on students’ current understanding of statistical literacy that would then inform future design decisions in a classroom teaching experiment.
Initial assessment of the students’ statistical literacy
The assessment was undertaken by students in normal classroom settings rather than under test conditions. The instrument consisted of eight tasks, each with a series of questions. Due to space limitations, we use four tasks that proved to be particularly useful for our purpose as instructional designers to discuss the stages in our framework. In contrast to traditional pedagogic setups which are limited to closed questions, in all our tasks students were provided opportunities to ask any questions they had about the data.
The students were told that the purpose of the assessment was to indicate how they used statistical information in everyday life situations. The students were required to read and think carefully about the various situations and if they were unsure of what to do they could ask for assistance.
Task 1 displayed information about children’s favourite junk foods in a bar graph. It required students to read information from the graph through to explaining their responses and asking worry questions.
In the “comparing temperatures” task (Task 2) students had to compare the temperatures in Auckland and Wellington and provide some explanations about how the temperatures change. They had to question how and why the data were collected and to think of the meaning within their context.
Task 3, called “The 100 metre race”, was set in the context of a championship. It addressed aspects of measures of centre and statistical variation. The open-ended question required students to make a choice using data provided in the form of a table and provide explanations for the choice.
Task 4 used the context of an advertisement involving Wonder Gel. Such statements are prolific in the media, and students were expected to think statistically, critically evaluate the statement and communicate their thinking in writing.
Task 1 (Favourite junk food)
The graph below shows information about children’s favourite junk foods. Have a look at the graph and answer the questions below.
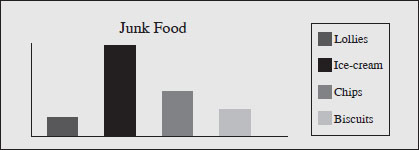
(a)What junk food did children say was their favourite junk food? Explain your thinking.
(b)What other information would you like before you can make decisions based on the graph? Explain your thinking.
Task 2 (Comparing temperatures)
Below are the temperatures (in degrees Celsius) on 12 consecutive days in Auckland and Wellington in September 2008.
Look at the temperatures from both the cities and answer the questions below.
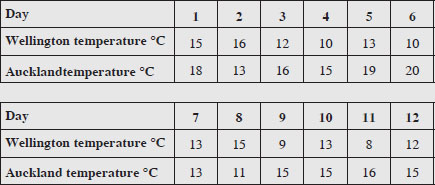
(a)Is Auckland warmer than Wellington? How do you know?
(b)Have you got any questions about the information presented in the tables? Explain your thinking.
Task 3 (The 100 metre race)
The following table gives the times (in seconds) that each girl has recorded for seven 100 metre races that they have run this year.
One girl is to be selected to compete in the upcoming championships.
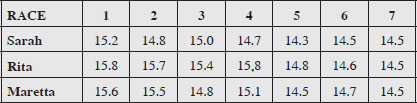
(a)Which girl would you select for the championships and why?
(b)Have you got any questions about the information presented in the tables?
Task 4 (Wonder Gel)
Mele reads an advertisement in a magazine at the hairdressers:
“Two out of three hairstylists use Wonder Gel”
What questions would you have about this advertisement? Explain your thinking.
Data analysis
Prior to developing the assessment tasks, we reviewed the literature on statistical literacy to clarify for ourselves: (i) the conceptions of statistical literacy; (ii) what the overall goals of our assessment might encompass; and (ii) assessment models used in research literature. From our readings, we found that Gal’s (2004) definition of statistical literacy and aspects of Watson and Callingham’s (2003) developmental sequence aligned most adequately with our purpose. However, due to the similarity of the characteristics in levels 1–3 (nonstatistical) we combined them (Stages 0–1 in our framework). As a result, the six levels (see Figure 2) were reduced to four stages. The four stages correspond to the realigned NCEA achievement standards.
Data from the assessment tasks were transcribed. Constant comparison analysis (Strauss & Corbin, 1998) was used to interpret the responses to the survey questions. The parts of the tasks form a coherent task but were analysed independently so that a student could make an incorrect calculation but demonstrate understanding of the context.
Coding of the written responses was undertaken in three stages. First, the researcher and the teachers coded the responses independently based on the four-stage framework we had created from the literature review. Secondly, level descriptors were revised based on newly identified descriptions of features. Finally, all responses were recoded independently by both the researcher and teachers based on the new descriptions. Further discussion was used to resolve disputed descriptors.
A four-stage framework to diagnose students’ thinking in statistical literacy As mentioned earlier, the framework is based on the Watson and Callingham’s (2003) Statistical Literacy Construct which included six stages. We have reduced the six levels identified to four stages. Students can exhibit the stages at any curriculum level. The boundaries between the stages are not hard edges but rather provide a set of stages that give a convenient way of describing changes as students progress to higher levels of thinking. It can be used to scaffold and assess students’ statistical literacy constructs.
The four stages are:
Stage 0–1: Informal/Idiosyncratic
Students at this stage are exhibiting characteristics of nonstatistical thinking:
•There is only an informal engagement with context, often reflecting intuitive nonstatistical ideas and beliefs.
•Due to reading or writing difficulty, students are unable to explain their thinking and often guess answers. With respect to statistical terminology, students provide random or inappropriate explanations.
•When making inferences, students focus on imaginative story telling or inappropriate aspects. Students use subjective reasoning to describe measures of centre or spread of data.
•Questions asked are not based on the data or focused on irrelevant contextual issues.
•Students are successful at some basic table and graph reading, as these require understanding of single elements and basic one-step straightforward reading.
Stage 2: Consistent Noncritical
Students at this stage are exhibiting characteristics of uni-structural thinking:
•Students focus on a single relevant aspect or attempt to attend to one or more relevant aspect of the data but have difficulty in integrating the aspects.
•Appropriate but noncritical engagement with context.
•Accurate use of statistical skills associated with simple statistics and graph characteristics.
•Single or partially correct comparisons made within a data table or graph.
•General or single statements made about the data collection methods and validity of findings with no reference to context.
•Questions asked are valid but based on one aspect of data.
Stage 3: Early Critical
Students at this stage are beginning to exhibit characteristics of relational thinking. They can attend to more than one relevant aspect of the data and are beginning to integrate the aspects:
•There is critical engagement in familiar contexts. There is selective engagement with unfamiliar contexts with some justification.
•There is appropriate use of terminology, qualitative interpretation of chance and appreciation of variation. Students demonstrate awareness of relevant features of displays, measures of centre and spread; however, these are primarily based on the data or the context but not both.
•Questions asked of the data are based on more than one aspect of data task but not always connected.
•Students are likely to relate several elements together about data collection methods and graphing. They can manage two variables at the same time.
Stage 4: Advanced Critical
Students at this stage are integrating statistical and contextual knowledge that exhibits abstract thinking:
•There is a critical, questioning engagement with context.
•There is an understanding of the purpose of the data, data displays, measures of centre and inferences made. There is a critical evaluation of data collection methods, choice of measures and validity of findings that shows appreciation of variation and the need for uncertainty in making predictions.
•Sophisticated statistical and mathematical skills are associated with success at this stage, especially in media contexts.
•There is the ability to interpret subtle aspects of language.
•Questions asked are based on relevant features of the data and the context using multiple perspectives.
Figure 3: Stage 1—Informal/Idiosyncratic
| Descriptors | Examples |
Explanation based on nonstatistical ideas, intuitive thinking or beliefs. No engagement with problem context. Inappropriate use of fair. | Ice-cream because ice-cream is sweet. Their favourite is ice-cream. You need to make sure the item you compare to another is the same. (Task 1(b)) Yes, because I went there for a trip. Wellington is a cold city. Auckland is a busier city than Wellington so more pollution. (Task 2(a)) Why do we have to select girls? Can’t it be mixed? (Task 3(b)) |
| Explanation based on basic mathematical skills associated with reading cell values. | Auckland because the hottest degrees in Auckland is 20 degrees and Wellington hottest temperature is 16 degrees. Yes, because it has got the biggest numbers. (Task 2(a)) I would select Rita because in 1, 2, 3, 4, 5 she has the highest. Rita, because she has the highest. (Task 3(a)) |
| Explanations based on inaccurate calculations or totals | Maretta because she has the best average and lowest times between them. Sarah has 110.5 seconds altogether, Rita 105.6 and Maretta 104.7. She has the lowest and therefore the fastest. (Task 4) |
| Questions asked are inappropriate or reproduce the words used in the task. | How many children don’t like ice-cream? Are they small or big? (Task 1(b)) What time of the year were these recorded? What was the highest temperature in Auckland? Did they record it in the same season? (Task 2(c)) Does your hair hold up when you use the gel? |
| Random or no explanations or questions. | What does the third hairdresser use? (Task 4) Ice-cream. Ice-cream because it is the most favourite junk food. Total amount, Bar graph.(Task 1(a)) I think they are both equal. They both cold. They are ages away. Wellington goes up and down. (Task 1(b)) Why did you have to use this advertisement? (Task 4) |
Figures 3 to 6 below illustrate the levels of students’ statistical understanding as they engaged with the questions discussed earlier. Student explanations and questions are mapped onto our Statistical Literacy Framework. The four stages, although examined separately, are closely linked. For example, the ability to analyse and interpret data builds on the ability to read data displays.
At Stage 0–1, the students were able to extract point information from the bar graph (Task 1: favourite junk food was ice-cream) and tables (Task 3: choose Rita because she has the highest). The students could find information by directly looking at the data display or comparing the data locally. However, there was no consideration of the context or data as a distribution. Random or no explanations or questions are likely to indicate reading/writing difficulties as the explanations could be lengthy and structurally complex. So students used random phrases such as They both cold. The response, Ice-cream because ice-cream is sweet indicates lack of engagement with the problem context and use of nonstatistical reasoning. This non-engagement with problem context could be related to children’s beliefs about sweet food. Since children like sweet food, they refer to their beliefs rather than focus on junk food survey (Task 1). When asking questions, students focus on inappropriate or idiosyncratic aspects; for example, the question: Why do we have to select girls? Can’t it be mixed? may be related to classroom activities where teachers use mixed ability grouping rather than focus on selecting a student for the championship (Task 3b).
Questions asked reproduce the words used in the task; for example, How many children don’t like ice-cream? What time of the year were these recorded? The responses also indicate a link to literacy skills for some students and the possible issues of reading a scenario. Figure 4 presents descriptions and examples of Stage 2 of our framework.
At Stage 2, responses indicate that statistical and literacy skills are sufficient for the problem to be understood but explanations focus on single features of data display or measures of centre, such as Yes, the mean temperature of Auckland is 15.5C while the mean temperature of Wellington is 12C without considering the need to integrate variability or context. Hence it is not just knowing curriculum-based formulas such as “add them up and divide by total number of values” but integrating these with an understanding of the increasingly sophisticated settings within which questions arise.
Figure 4: Stage 2—Consistent Noncritical
| Descriptors | Examples |
| Responses based on accurate use of statistical skills associated with sample statistics and graph characteristics. | Ice-cream was the favourite because 50% of the students in the survey said it was their favourite. (Task 1(a)) Auckland is warmer because most days Auckland had a higher temperature. There were only 2 days which had Wellington as the warmest and 1 day where both cities had the same temperature. Yes, the mean temperature of Auckland is 15.5C while the mean temperature of Wellington is 12C. (Task 2(a)) How many children were involved in this? (Task 4) How many children in the class? (Task 1(b)) |
| Questions asked appropriate but no engagement with statistical context. | What is Wonder gel? (Task 4) |
Figure 5: Stage 3—Early Critical
| Descriptors | Examples |
| Explanations based on reasonable comparisons within data sets. | Yes, because Auckland had more warmer days than Wellington. The average temperature of Wellington is 12.16 degrees. The average temperature of Auckland is 15.5 degrees. (Task 2(a)) I would send Sara, I chose her because her total is the lowest so she would be faster therefore she will be better in the championship. (Task 3(a)) |
| Questions asked focus on more than one element of data and context. However, there is no or only partial justification for question. | How many kids took the survey and what is 1% equal to—how many votes? What time of the day was each temperature taken? (Task 2(a)) Were the races held in the same location? Were they at the same time? How many hairstylists were surveyed? Was the survey random or systematic? Was the survey representative of all hairstylists? (Task 4) |
At this stage, questions asked are likely to detect the critical features for representativeness or bias. For instance, How many children were involved in the survey? is judged as an appropriate question in this question because sample size can influence validity of findings.
At Stage 3, students start to appreciate many contexts although they cannot go further to explain/question data. In terms of questioning the Wonder Gel (Task 4), students present sample size, representativeness and random ideas such as How many hairstylists were surveyed? Was the survey random or systematic? Was the survey representative of all hairstylists? However, there is no evidence of the integrating of the statistical and contextual information. The next section describes the final stage of our framework.
Figure 6: Stage 4—Advanced Critical
| Descriptors | Examples |
| Explanations based on data and the context using multiple perspectives. For example, students were able to make observations about what they saw in the table (Task 2) and give reasons for the differences, taking into account what they know about the context. | Auckland is warmer because it is further down on the North Island and Auckland has more warmer days than Wellington during the 12 days they recorded. (Task 2) I would choose Sarah because she has the fastest mean and she performed consistently through the championship. Sarah as she has the shortest time of 14.3. She is also consistent and is mostly in the 14 seconds. (Task 3) |
| Questions asked are based on relevant features of the data and the context and supported with statistical concepts and processes. | I would like to know if they maybe raced together in the same heats and all and maybe when the races were because from that you could maybe estimate the conditions. (Task 3) |
At the top stage of the Statistical Literacy Framework, students demonstrate critical thinking skills associated with sampling, measures of centre and data display. As mentioned previously, sophisticated statistical and higher order skills are associated with success at Stage 4, specially in media contexts. For the junk food task students are likely to suggest random methods or random methods combined with representation such as 100 boys and 100 girls picked at random. Students are able to balance the influence between cognitive and contextual factors.
Implications for teaching, assessing and research
The data used in this paper were collected as part of a study into students’ development of statistical literacy. The purpose of this paper was to document the hierarchical nature of the statistical literacy construct and present a simple framework that could be useful for teaching and assessing this literacy. Although the data reflected a wide range of responses, they may not represent the whole population of New Zealand. Other cultural settings may result in students responding differently to these context based on open-ended questions. We believe that the students who participated in this study are likely to have experiences similar to other students.
The limitation can also relate to researcher prejudices and biases. Since we were both the practitioners and the researchers, test design, data collection and analysis could have been affected by our predispositions and biases. However, trustworthiness was achieved by subjecting our framework to scrutiny and critique by colleagues. We considered our work as belonging to the community and made it available for public scrutiny and critique through the Mathematics and Statistics Associations, quarterly reports and mentors. This may increase the chance that the framework becomes useful to other mathematics educators and researchers. Major implications for practice and research that can be drawn from this paper are discussed below.
Our framework describes a four-stage hierarchy characterised by increasingly complex cognitive processes in which both statistical processes and contextual understanding are involved. It provides useful information regarding the type of statistical literacy that can be expected at different stages. The framework can help teachers to identify appropriate starting points of teaching and anticipate shifts in students’ statistical literacy during teaching. For example, if students compare the totals or the mean in the 100 metre race task (Task 3), teachers could draw their attention to the context of the situation to move them to the next stage.
It may be quite easy to teach students how to extract point information from data in tables and graphs (Stage 1) but it may be more difficult to help them develop strategies to question how and why the data were collected, to make comparisons within and between categories and to think about the meaning of data in context. This is what the framework can help teachers do in conjunction with sound pedagogical teaching and learning of statistical concepts. It can provide a means for teachers to scaffold their students’ thinking through the development of examples such as those illustrated in this paper.
We believe that assessment practices must go beyond adding up scores of correct and incorrect answers. Much more understanding about students’ statistical literacy can be obtained when tasks and frameworks allow for demonstration of several levels of student thinking. Questions need to be structured to allow for varying degrees of difficulty. Some may build up interest through an extended series of questions as in the junk food task whereas others are shorter but striking in their context, as in task 4.
The questions in our assessment were used as paper and pencil test items. The written nature of the assessment satisfies at least one dimension of Gal’s (2004) requirement to communicate opinions in writing to statistical information. They can also be used as a basis for individual interviews with students where the teacher might intervene with additional questions such as “Who did the survey?” when students are unsure of their responses. It is also possible to integrate tasks like these with classroom activities. The tasks may be motivating to use with groups of students. Group responses could be assessed directly or used as a basis of classroom discussion or debate about the validity of statements. This could lead to an extended discussion about becoming critical consumers of information in the media.
This small-scale investigation into identifying and describing students’ reasoning in regards to statistical literacy constructs has opened up possibilities to do further research at a macro-level on students’ thinking and to develop more explicit descriptors for each stage of our framework. Such research would validate the framework of response levels described in the current study and raise more awareness of the levels of thinking that need to be considered when planning instruction and developing students’ statistical thinking.
The use of open-ended tasks allowed for the identification of bias in everyday settings and gave students the opportunity to display their understandings at increasingly higher levels of thinking of the framework. However, some gaps in the content covered with respect to topics in the curriculum emerged when we considered the overall framework. For example, there were few items relating to more complex graphs and probability. There were also issues with the wording and format of tasks. Such issues could be addressed in future research.
Another implication for further research could be to replicate the present study and include a larger sample of students from different socioeconomic and educational backgrounds to claim generality. A sample of these students could be interviewed individually or in groups in order to probe their thinking at a greater depth. This will provide information that will allow reliable and valid inferences to be made about students’ understanding regardless of the context of the assessment task.
Another step in future research is to analyse data on individuals at a different year level to explore the hypothesis that indeed the hierarchical structure observed in this study represents a developmental sequence that could be expected at any curriculum level.
Like Gal (2004), we believe that dispositions play a key role in how students think about statistical information or act in situations that involve data in the real world or in the classroom. It may influence students’ willingness to ask critical questions. Development of research instruments in this area is crucial for understanding the factors that shape statistically literate behaviour in diverse contexts. We could start with questions such as:
What are the student attitudes and motivation towards statistical literacy and the way we can teach it? How can we modify our teaching methods to improve student attitudes?
The notion of critical questions or the need for students to become familiar with flaws and biases in statistical information is a key aspect of our Statistical Literacy Framework. Like other researchers, we argue that appropriate critical questions can be extracted from media articles. Furthermore, we recommend that these questions may be introduced in the primary curriculum, as there is a need for children to begin to question statistical reports at an early age. Whitin and Whitin (2003) claim that even kindergarten children can be encouraged to question statistical information in a range of contexts.
In our view, existing classroom work tends to focus more on generating data rather than interpreting or critically evaluating other studies or reports. The focus is mostly on students going through the statistical inquiry cycle. Students are expected to be able to work through the exercises by themselves with the teacher available to help them. In light of changed curriculum expectations (see OECD, 2005; Steen, 1997) and extended social expectations for statistical literacy (e.g., Gal, 2004) teachers across the different learning areas (Watson, 2000) may have increased demands placed on them in terms of developing statistical literacy. It is likely that professional development for teachers may be needed if they are to support their students to achieve the highest levels of statistical literacy before they leave formal schooling.
Acknowledgement
This research is funded by the Teaching and Learning Research Initiative (TLRI) at the University of Waikato, Developing Secondary School Students’ Understanding of Statistical Literacy in a data analysis environment.
References
Ainley, J., & Pratt, D. (2010). It’s not what you know, it’s recognising the power of what you know: Assessing understanding of utility. In C. Reading (Ed.), Proceedings of the 8th International Conference on the Teaching of Statistics. Ljubljana, Slovenia: International Statistical Institute and International Association for Statistical Education. Retrieved from http://www.stat.auckland.ac.nz/~Iase/Publications
Begg, A., Pfannkuch, M., Camden, M., Hughes, P., Noble, A., & Wild, C. (2004). The school statistics curriculum: Statistics and probability education literature review. Auckland: Auckland Uniservices Ltd, University of Auckland.
Best, J. (2001). Damned lies and statistics: Untangling numbers from the media, politicians and activists. Berkeley, CA: University of California Press.
Biggs, J., & Collis, K. (1982). Evaluating the quality of learning: The SOLO taxonomy. New York: Academic Press.
Budgett, S., & Pfannkuch, M. (2010). Using media reports to promote statistical literacy for non-quantitative major. In C. Reading (Ed.), Proceedings of the 8th International Conference on the Teaching of Statistics. Ljubljana, Slovenia: International Statistical Institute and International Association for Statistical Education. Retrieved from http://www.stat.auckland.ac.nz/~Iase/Publications
Gal, I. (2004). Statistical literacy: Meanings, components, responsibilities. In J. Garfield & D. Ben-Zvi (Eds.). The challenge of developing statistical literacy, reasoning and thinking (pp. 47–78). Dordrecht, The Netherlands: Kluwer.
Garfield, J. B., & Ben-Zvi, D. (2008). Preparing school teachers to develop students’ statistical reasoning. In C. Batanero, G. Burrill, C. Reading & A. Rossman (Eds,), Joint ICMI/IASE study: Teaching statistics in school mathematics, Challenges for teaching and teacher education. Proceedings of the ICMI Study 18 and 2008 IASE Roundtable Conference.
Garfield, J., delMas, R., & Zieffler, A. (2010). Assessing statistical thinking. In P. Bidgood, N. Hunt & F. Jolliffe (Eds.), Assessment methods in statistical education: An international perspective (pp. 175–186). Chichester: John Wiley & Sons.
Ministry of Education. (2007). The New Zealand curriculum. Wellington: Learning Media.
Organisation for Economic Cooperation & Development (OECD). (2005). Definition and selection of key competencies—Executive summary. Retrieved from http://www.deseco.admin.ch/bfs/deseco/en/index/02.html
Schield, M. (2010). Assessing statistical literacy: Take CARE. In P. Bidgood, N. Hunt & F. Jolliffe (Eds.), Assessment methods in statistical education: An international perspective (pp. 133–152). Chichester: John Wiley & Sons.
Sharma, S., Doyle, P., Shandil, V., & Talakia'atu, S. (2011). Developing statistical literacy with year 9 students. set: Research Information for Teachers, 1, 43–60.
Shaughnessy, J. M. (2007). Research on statistics learning and reasoning. In F. K. Lester Jr (Ed.), Second handbook of research on mathematics teaching and learning (pp. 957–1009). Reston: The National Council of Teachers of Mathematics.
Steen, L. A. (Ed.). (1997). Why numbers count: Quantitative literacy for tomorrow’s America. New York: College Entrance Examination Board.
Strauss, A., & Corbin, J. (1998). Basics of qualitative research: Techniques and procedures for developing grounded theory. Thousand Oaks, CA: Sage.
Wallman, K. K. (1993). Enhancing statistical literacy: Enriching our society. Journal of the American Statistical Association, 88(421), 1–8. Retrieved from ABI/INFORM Global database. (Document ID: 5214327)
Watson, J. M. (1997). Assessing statistical literacy using the media. In I. Gal & J. B. Garfield (Eds.), The assessment challenge in statistics education (pp. 107–121). Amsterdam: IOS Press and The International Statistics Institute.
Watson, J. M. (2000). Statistics in context. The Mathematics Teacher, 93(1), 54–58. Retrieved from Academic Research Library database. (Document ID: 47622729)
Watson, J. M. (2006). Statistical literacy at school: Growth and goals. Mahwah, NJ: Lawrence Erlbaum.
Watson, J. M., & Callingham, R. (2003). Statistical literacy: A complex hierarchical construct. Statistics Education Research Journal, 2(2), 3–46.
Watson, J. M., & Callingham, R. (2005). Statistical literacy: From idiosyncratic to critical thinking. In Burrill, G. & Camden, M. (Eds.), Curricular Development in Statistics Education: International Association for Statistical Education 2004 Roundtable, (pp. 118-162). Voorburg: International Statistical Institute.
Whitin, D., & Whitin, P. (2003). Talk counts: Discussing graphs with young children.
Teaching Children Mathematics, 10(1), 142–149.
The authors
Sashi Sharma is a Senior Lecturer, Department of Mathematics, Science and Technology Education at The University of Waikato. She teaches mathematics education papers in a number of programmes. Her research interests include statistics education, language and cultural issues and teacher education.
Email: sashi@waikato.ac.nz
Phil Doyle is Deputy Principal at De La Salle College, Auckland
Viney Shandil and Semisi Talakia'atu teach at Marcellin College, Auckland