Diagnosing misconceptions in science
Understanding Planet Earth and Beyond
Chris Marston  New Zealand Council for Educational Research
This is the second article outlining some of the findings from the trialling of science resources for the Assessment Resource Banks (ARBs) being developed by the New Zealand Council for Educational Research, under contract to the Ministry of Education. By April 2000, there were 923 science resources covering level 2 to level 5 of the curriculum (see NZCER’s website, http://www.nzcer.org.nz). The first article (Marston and Croft, 1999) outlined how the resources in the bank have been developed, and covered aspects of the Living World science strand.
In the contextual strand Planet Earth and Beyond, there are 169 resources; 16 are classified at level 2, 38 at level 3, 77 at level 4, and 38 at level 5 of the curriculum. Each resource comes complete with a question or series of questions, a scoring guide, and a difficulty estimate. The difficulty estimate is based on the overall percentage score achieved by the students who trialled the questions. Usually this is a sample of 200 students in a given year group. In addition, approximately 30% of the Planet Earth and Beyond resources have had diagnostic data added to them.
Diagnostic data is gained by analysing student responses from every second script. This analysis is usually concerned with patterns of misconceptions, but sometimes it looks at the types of correct responses given to a particular question. All resources with diagnostics can be searched for by placing the term “diagnostic” in the key word search box.
This article focuses on some of the points of interest that have emerged from trialling Planet Earth and Beyond resources at levels 3 and 4 of the curriculum, and analysing the responses. For trialling purposes, level 3 resources are typically completed by Year 6 students, and level 4 resources by Year 8 students.
Planet Earth and Beyond, level 3, objective 3, concerns our solar system, including the Earth and its moon. Most students could match planets with their descriptions (ARB No. PE9025), and on average, 69% of students could match a specific planet with its description. However, students were less knowledgeable about the environment of the moon and planets. For example, PE9024 (Fig.1) asked students to write about spacesuits in relation to survival on the moon. The student responses to this question have been analysed to gain an insight into which aspects of the moon and its environment students know about.
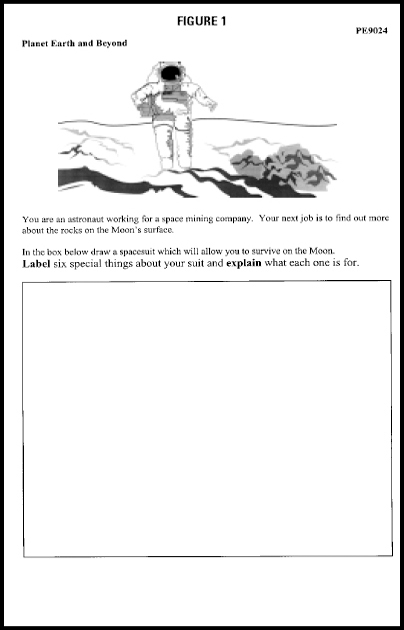
Table 1 gives a summary of the nine most common spacesuit features explained by students, and the percentage of students who mentioned each feature. Fourteen percent of students were able to give 6 features and to score the maximum. By analysing these results, we can see the areas where students are likely to have some understanding, and the areas where their understanding is less strong. For example, 40% of the students whose scripts we sampled could explain some reason for the astronaut needing an air supply.
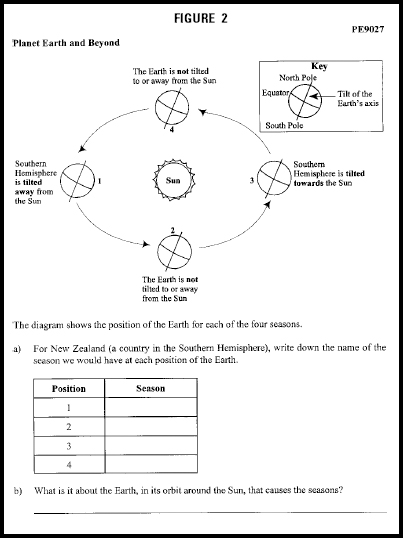
Level 4, objective 3(b) of the curriculum in Planet Earth and Beyond covers relationships between the Earth, its moon, and the Sun, and some of the patterns associated with these relationships. A question from PE9042, which was trialled with Year 4 students, asked them to write down the names of the seasons in their correct order. It was found that 40% could successfully do this. PE9027 (Fig.2) asks students to identify the seasons for the Southern Hemisphere as the Earth moves around the Sun, and the cause of these seasons.
Trialling showed that only 39% of students were able to name the correct season in each of the four positions shown, although nearly 50% did maintain the correct season order in their answer. When asked to explain the reason for the different seasons, only 20% could successfully do this.
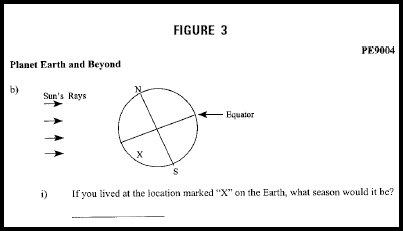
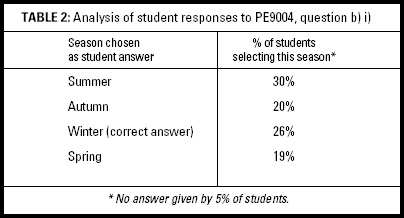
These results confirmed the analysis of responses to PE9004, question b) i) (Fig. 3). This analysis is shown in Table 2.
It is interesting to note the similar percentages of students choosing Summer and Winter, and also Spring and Autumn. But overall, there appears to be a guessing pattern. This indicates that the students had no real understanding of the cause of seasons.
Another aspect of seasons was asked about in PE9031, question a):
PE9031
If it was the middle of winter in New Zealand on June 21, when would it be the middle of winter in England (in the Northern Hemisphere)?
The acceptable answers were December 21, December 22, or 6 months later. This question proved to be of similar difficulty, with only 25% giving a correct answer.
The concepts of one day and one year were asked about in PE 9018.
PE 9018
While the Earth orbits the Sun it is also spinning on its axis.
a)&&How long does it take for the Earth to complete one revolution on its axis?
b)&&How long does it take for the Earth to orbit the Sun?
These questions were trialled on Year 8 students in April 1998. They were answered successfully by 55% of the students, indicating much more widespread understanding of these concepts.
Resources PE9004, PE9008, and PE9032 ask about shadow and shadow length, and the position of the Sun. When asked in which direction the Sun rose in the morning, 56% of Year 8 students chose the correct answer: that when a person is looking north, the Sun will be rising to their right. However, 26% chose “to their left”.
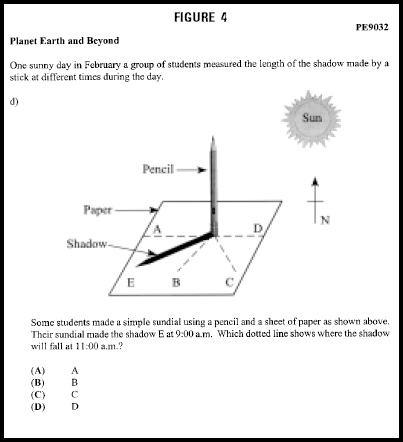
Understanding shadow movements has always seemed to cause much greater problems for students. PE9032, part d) (Fig.4) asks about this.
Analysis of the answers showed that the correct option, B, was selected by 31% of Year 8 students in the trial. However, 34% chose A, and 25% chose C. In the preceding part of PE9032, students were asked to graph shadow length against time, and then to explain the reason for the changing length of shadow. While graphing the data and interpreting one aspect of the graph proved relatively easy, writing an accurate summary of what the graph was showing could be done by only 40% of students. When it came to explaining the reason for shadow length change, only 11% of students could successfully do this. Shadows have clearly proved to be a relatively difficult concept for students to explain at this level.
These are just a few examples of the diagnostic information found for 30% of the Planet Earth and Beyond resources. It is hoped that providing this diagnostic information will enable teachers to gain a better understanding of student capabilities, including both strengths and weaknesses, and of students’ ability to succeed in learning various areas of the science curriculum.
Teachers can also gain further insight into how students might perform in a given area by looking at the difficulty level assigned to each question as part of a resource. This difficulty level is based on the percentage of students in the trial who correctly answered each particular question part. It can be found on the scoring page.
A future article will examine how well Year 8 students in the ARB trials understood various aspects of New Zealand’s weather systems.
References
Marston, C. and Croft, C. (1999). What do students know in science? Analysis of data from the Assessment Resource Banks, set 2, Item 12.