Diagnosing misconceptions in mathematics
Using the Assessment Resource Banks to remedy student errors
Alex Neill New Zealand Council for Educational Research
The Assessment Resource Banks (ARBs) are computerised banks of assessment material which are based on the New Zealand curriculum statements in mathematics, science and English. They are all at Levels 2 to 5 of the curriculum, except for a few science resources at Level 6. The ARBs first opened in 1997. As at the end of February 2000, there were 845 mathematics, 875 science and 227 English resources. They can be used not only for summative assessment, to identify what a student has achieved, but also for formative or diagnostic assessment, to identify and remedy student problems.
One of the main purposes of the ARBs is to give teachers a wide range of assessment material. This includes formative and diagnostic assessment as well as summative assessment. This paper looks at the formative and diagnostic dimensions in more detail. (For a discussion on the seven different types of assessment the ARBS can be used for, see Croft, 1999.)
The ARBs can supplement the assessment tools that schools currently use. The ARBs are at the more formal end of assessment, but they do incorporate a variety of question types. They include multiple-choice questions, as do most item banks. They also include questions where the students have to construct their own responses or perform practical tasks (Croft, 1998).
The ARBs are available to all New Zealand schools free of charge. The project is being developed by the New Zealand Council for Educational Research under contract to the Ministry of Education. The ARBs are accessible on the Internet at www.nzcer.org.nz but users must apply for a password.
The ARBs let teachers find relevant resources using the search capability of the Internet. They incorporate a classification system based on the New Zealand curriculum statement. This allows teachers to match their own teaching and curriculum objectives. Teachers can then design valid assessments specific to their own classroom and school requirements.
Resources are written by panels of teachers, NZCER staff (which include primary and secondary teachers) and other consultants. Before a resource is added to the banks, it goes through an extensive process of reviewing and trialling to ensure maximum validity and usefulness. Trials involve about 200 students. This allows each resource to be given a level of difficulty, as well as ensuring that it meets strict reliability criteria. Individual schools can use the level of difficulty as a benchmark to compare their own pupils’ performance with a national sample.
Diagnostics and the ARB
Analysis of the ARB trials initially centred on the correct answers. This left a large part of the data untapped, namely the pattern of incorrect responses. During work on the ARB mathematics project, it became increasingly clear that the incorrect answers which students came up with provided valuable insights into their thinking, the common misconceptions that they held, and the incorrect processes that they were applying. These wrong responses are now being turned into diagnostic information.
Diagnostic information can be used by teachers in their planning, as it gives an indication of how difficult or easy the area they plan to teach is. It also gives them information on the misconceptions they are likely to encounter among their students. It can be used diagnostically to help identify possible causes of particular errors. This can be fed back into teaching to help rectify students’ misconceptions or errors in performing the mathematical activities.
For classroom use, teachers may wish to have a face-to-face conference with an individual student to confirm the cause of error. They may also have a small group session, a whole class discussion, or a whole class teaching session. The diagnostic information can be used in these sessions as starting points to help teachers establish the true causes of error.
Analysing incorrect responses to create diagnostics
To produce diagnostic information on a question, the pattern of incorrect answers must be analysed. This is a routine task for multiple-choice questions. If students construct their own responses, then the likely underlying causes for the incorrect responses must be analysed.
In mathematics the answers are often numerical. There is a need to unwrap the likely cause of the wrong numerical answer. The likely incorrect calculation is given, with an accompanying likely underlying cause. Sometimes a wide range of wrong numerical answers are given. One ARB resource had 60 different wrong answers given by students (of the 300 students sampled). Thirty of these wrong answers had clear diagnostic potential (Neill, 1997), although not all of these could be quoted on the actual resource. For many incorrect responses, however, no likely underlying cause could be identified. If the answer is not numerical in nature, only a likely underlying cause is given.
A two-pronged approach is used to analyse constructed responses. Firstly, our markers look for common incorrect responses as they mark. The markers can sometimes infer the misconceptions from clues in the students’ scripts (their working, etc.). A subsample of approximately two classes of students have their scripts analysed in a more rigorous way.
The causes of the errors are then inferred from the wrong answers. It would be more satisfactory, of course, to be able to ask the students what their thinking processes were. However, this would be an enormous task to perform on hundreds of questions given to scores of students. The approach of inferring the misconception is ideal for numerical responses. It is highly probable that a numerical answer has been arrived at via the anticipated method, and there is only a slight chance that an alternative logic has been applied. Sometimes the erroneous calculation has been written in the margin of the test script, increasing the marker's confidence that the misconception is the one identified.
On the other hand, in a multiple-choice situation each distracter has a diagnostic explanation, but we do not know if the student engaged in this anticipated logic, or used alternative approaches such as language clues or other test-wise strategies. They may well have been guessing, in which case the diagnostic potential of the distracters drops to zero. There is usually less evidence of working associated with multiple-choice responses.
Producing diagnostics
Two criteria are used for establishing diagnostics:
- Is the error common to many students?
- Is there a clearly definable misconception or incorrect process that the response indicates?
Example 1
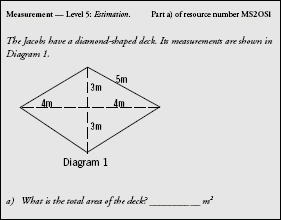
All the incorrect answers to example 1 that students in the sample came up with were analysed. The answers where a likely calculation was identified are recorded in Table 1 below.
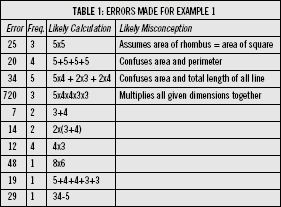
The diagnostics are then written onto each resource, with the common errors and the likely misconception identified. Often this is accompanied by the likely calculation that the pupil has used. These diagnostics are specific to the actual questions in an individual resource. The first four items from Table 1 have been included in the diagnostics attached to resource MS205 1. The remaining ones were ignored, because too few students came up with that answer, or there was no clear reason for the error.
Examples of diagnostics
Most of the examples are drawn from Level 5 of the curriculum. However, the principles they demonstrate are equally applicable for any level of the curriculum.
Example 2
Measurement — Level 5: Time, rate, and change. MS2672
A car travels 1 kilometre in 1 minute 12 seconds. At this rate, how many kilometres will the car travel in 1 hour? _____________ km
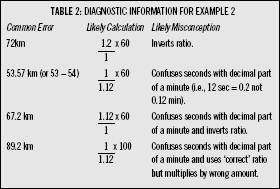
These diagnostics indicate problems with the correct form of the ratio, as well as problems with time. The last three diagnostics indicate that students treat 12 seconds as 0.12 minutes. This is equivalent to saying that there are 100 seconds in a minute.
In general, diagnostics apply to the strand of mathematics which the resource is being used to assess. In some instances there is clear diagnostic information available in other strands. This does not undermine the validity of the question, but instead it adds to the amount of data the teacher has. Often the additional diagnostics will relate back to the Number strand, as concepts of number and computation are common to much of mathematics.
Example 3
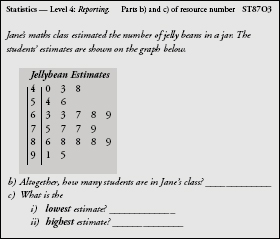

This example of the stem-and-leaf highlights several interesting issues. Firstly, it has become clear from several of our trials that students are not being exposed to stem-and-leaf graphs, especially in the primary schools. The curriculum specifies that they should be introduced at Level 2. While some teachers feel that students are not ready for these graphs at Level 2, studies (Dunkels, 1991) have shown that they can be successfully taught at this stage, provided that students have a firm grasp on place value, and the ordering of numbers (Young-Loveridge, 1998, 1999).
The stem in this example is the tens, and the leaves are ones. The leaves are ordinal numbers, not a single compact numeral, as some Form 3 students believe. Distinctions between the ordinal nature of the data (leaves) and the cardinal nature of the frequency of the leaves within a stem can be exploited. Hence testing stem-and-leaf graphs can help identify misconceptions in number as well as in statistics.
Example 4
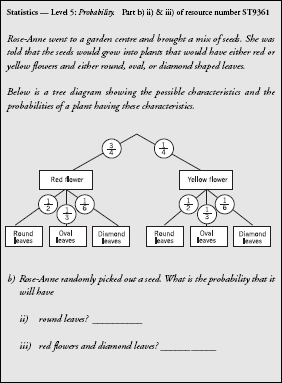
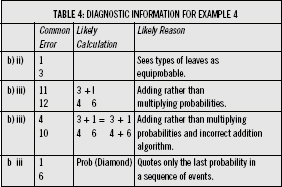
The third of these diagnostics shows a misconception that is not directly a statistics error. Instead it demonstrates that the pupil does not know how to add up fractions correctly.
Example 5
| TABLE 5: DIAGNOSTIC INFORMATION FOR EXAMPLE 5 |
| a) |
Common Error 201(200.1) |
Likely Reason
Treats divisions as 10 (or 0.10) rather than 200.
Place value error. |
|
202 |
Treats divisions as 20 rather than 200.
Place value error. |
|
210 |
Treats divisions as 100 rather than 200. |
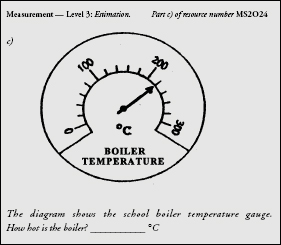
For example 5, students were asked to read a thermometer. Their answers show misconceptions in how to read a scale (a Measurement objective), as well as misunderstandings about the place value of numbers (a Number objective). Many problems in mathematics have a root cause in the lack of understanding of the central issue of place value.
Other diagnostic approaches
Several authors have addressed the issue of diagnostic information in mathematics. There are two distinct styles of diagnosis: focusing on the mathematical errors made (Palmer, 1994; Booker, 1995); and looking at a wider range of error sources (Newman, 1977, 1983; Kirsch and Mosenthal, 1993). The New Zealand mathematics curriculum espouses a model of mathematics in a real world context (MoE, 1992). This makes the work of authors such as Newman more relevant, as they identify a wider range of error types. However, authors such as Palmer and Booker more clearly delineate mathematical misconceptions, so their work is very useful too. Newman looks at five dimensions where the error may occur:
1. Reading the problem.
2. Comprehending what is read.
3. Transforming the problem into the appropriate mathematical form.
4. Applying the process skills selected correctly. This means correctly performing the mathematics involved.
5. Encoding the answer in an acceptable written form.
This model is similar to that of Kirsch and Mosenthal, who describe three dimensions:
1. Identification: broadly speaking, this encompasses the reading and comprehension dimensions.
2. Problem formulation: this is the same as Newman's transformation dimension.
3. Computation: this has a somewhat narrower connotation than does process skills.
However, Newman's encoding dimension is a vital extra dimension that completes the model.
Two distinct styles exist for deciding what category of error has been made. Both Newman and Booker use one-to-one interviewing of children. While this is ideal, it is often not practical in a classroom setting, nor even for producing large collections of questions such as the ARBs.
The alternative approach is to perform a test. Typical options are the PAT test (Reid, 1993) or the Diagnostic Mathematics Profiles (Doig, 1990), or a school or teacher produced pre-test. In the ARBs, however, we were not able to exploit the cumulative diagnostic evidence directly, but had to infer it from students’ answers, or occasionally from their working.
To demonstrate the different classes of Newman errors, Example 6 has been analysed. This example comes from the Number strand:
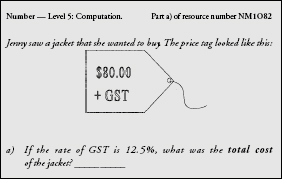
Example 6
Reading/Comprehension
If an answer of $10 is given, the likely explanation is that the student did not read carefully. They gave the GST component rather than the total cost.
Transformation
If the answer given is $92.50, it is highly likely the student added $80.00 and 12.50. This means they did not transform the problem into the appropriate mathematics.
Processing
If the answer given is $86.40, it is highly likely that the student made an error in turning 12.5% into 0.08 (i.e they confused one eighth and 0.08). This is an error in the processing of percentages and decimal fractions.
Encoding
If the answer given is $9000, the student has wrongly encoded 9000 cents as $9000.
If these errors were commonly seen, then they would be included in the resource as a diagnostic. This would be specific to the actual resource, rather than being described in more general terms.
Although detailed discussion of errors is beyond the scope of this paper, it is interesting to note that many errors stem from reading or comprehension errors. This is particularly true in the Number strand. This finding persists right through to Level 5, which we have typically tested on Year 10 students. Many other errors indicate that the student cannot turn the word problem into the correct mathematics (i.e. a transformation error). Less than half of the diagnostics concern incorrectly performing the appropriate mathematics. The reading component is probably underestimated in mathematics, because students who cannot adequately read the questions will either not respond at all, or come up with idiosyncratic answers that will not lead to diagnostic information.
Other potential uses of the ARBs
With the exception of a few papers on the diagnostic uses of the mathematics or science bank (Neill, 1997, 1998; Gilbert and Neill, 1999; Croft, 1998; Marston and Croft, 1999), most other articles on the ARBs have concentrated on their development and organisation, or on how teachers can access the resources and use them for classroom assessment.
Clearly, there is broader information available from the ARBs than sets of resources containing items and tasks for classroom assessment purposes. As indicated in the examples covered earlier, the ARBs provide solid empirical data to underpin formative assessment.
This is the fundamental purpose of the ARBs in classrooms (Croft, 1999, p.32). These data may be used to alert teachers in advance of teaching a topic to:
- possible misconceptions their students might demonstrate
- common errors they might make
- aspects of their study that they are likely to master readily
- understandings they may generalise to other aspects of their learning.
The information on common errors and misconceptions may also play a role in helping teachers and children create realistic expectations of what children might know about particular aspects of mathematics. Knowing, for example, that stem-and leaf graphs are often not known at Levels 2 to 4 will help put individuals’ accomplishments related to these graphs into a firmer framework of expectations.
Beyond individual schools or classrooms, accumulated ARB data will help indicate areas of the mathematics curriculum where national samples of children are performing strongly or weakly.
Beyond individual schools or classrooms, accumulated ARB data will help indicate areas of the mathematics curriculum where national samples of children are performing strongly or weakly. Insights of this nature would be invaluable if an empirical review of the curriculum were to be undertaken. They would also be a major improvement on simply relying on teachers’ unsupported anecdotal judgments about the areas of the curriculum that “work” and those that “do not work”. As the ARBs accumulate valuable data on national achievement in these three learning areas, they will become sources of information on national achievement trends. They will also provide an objective basis for reviewing curriculum statements and focussing teachers’ professional development, in order to strengthen students’ achievement in identified areas of these curriculum statements.
Information based on the performance of diverse national samples on ARB resources is potentially more useful than data from mandatory national testing, when the data are required for curriculum review purposes. This is basically because data accumulated from ARB resources administered in many classrooms enable a broader range of curriculum outcomes to be assessed than is possible under the restrictions of national tests.
A key point about the diagnostics part of this paper is that it is worth reflecting on the processes that a student may have used to come up with an incorrect answer. Often the answer alone will provide enough clues, This is especially so when the answer is a constructed response and is numerical. Incorporating diagnostic information about common incorrect answers, and likely explanations, gives teachers a powerful tool, not only to test students’ understanding, but also to remedy their misconceptions. Road-blocks to student understanding and learning can be identified, and appropriate strategies to remedy them can be developed.
ALEX NEILL is a research officer at NZCER. His background is in teaching and statistical research for the former DSIR.
Email: alex.neill@nzcer.org.nz
REFERENCES
Booker, G. (1994). Booker profiles in mathematics numeration and computation. Melbourne: Australian Council for Educational Research.
Croft, C. (1998). Testing on the net: Assessment Resource Banks in mathematics and science. set: Research Information for Teachers, 1.
Croft, C. (1999). School-wide assessment: Using the Assessment Resource Banks. Wellington: New Zealand Council for Educational Research.
Doig, B. (1990). Diagnostic mathematical profiles. Melbourne: Australian Council for Educational Research.
Dunkels, A. (1991). Interplay of the number concept and statistics using attitudes and techniques of EDA. Proceedings of the third international conference on teaching statistics, Dunedin: ISI Publications in Statistical Education, pp.129-139.
Gilbert, A and Neill, A. (1999). Assessment Resource Banks in mathematics and their diagnostic potential. Paper presented at NZAMT conference, Dunedin, New Zealand.
Kirsch, I. and Mosenthal, P. (1993). Strategies for solving math document problems. Journal of Reading, 36 (6), pp.498-501.
Marston, C. and Croft, C. (1999). What do students know in science? Analysis of data from the Assessment Resource Banks. set: Research information for teachers, 2.
Ministry of Education (1992). Mathematics in the New Zealand curriculum. Wellington: Ministry of Education.
Newman, M. (1977). An analysis of sixth-grade pupils’ errors on written mathematical tasks. Victoria Institute for Educational Research Bulletin, 39, pp.31-43.
Newman, M. (1983). Strategies for diagnosis and remediation. Sydney: Harcourt, Brace, Jovanovich.
Neill, A. (1997). Time or place? Diagnostic information in mathematics. Paper presented at 19th NZARE conference, Auckland, New Zealand.
Neill, A. (1998). Assessment Resource Banks in mathematics: How can we help teaching and learning? Mathematics teaching: where are we at? Seminar proceedings. Wellington: New Zealand Council for Educational Research.
Palmer, D., Kays, M., Smith, A., and Doig, B. (1994). Stop, look and lesson: Manual. Melbourne: Australian Council for Educational Research.
Reid, N. (1993). Progressive Achievement Test of mathematics. Wellington: New Zealand Council for Educational Research.
Young-Loveridge, J. (1999). The acquisition of numeracy. set: Research Information for Teachers, 1.